Figure 4.
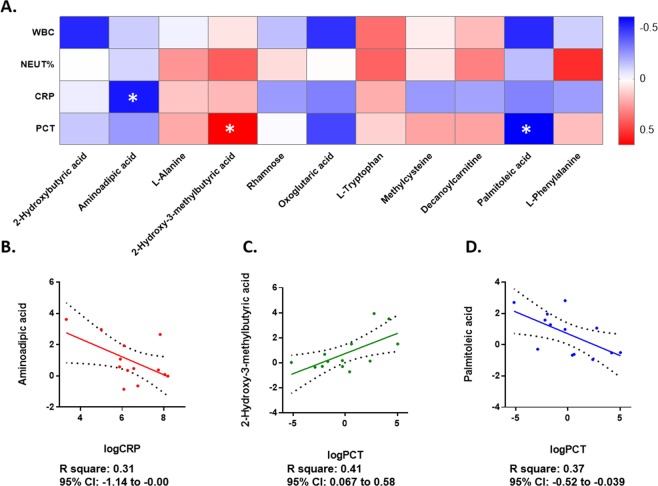
Dysregulated metabolites were correlated to clinical inflammatory markers in young CAP. (A) Correlations between CRP, PCT, neutrophil percentage and WBC count and altered metabolites and ratios in young CAP adults. The colors in the heatmap stood for efficiency of the Pearson’s correlation. *p < 0.05, **p < 0.01. (B) Simple linear regression model with log 2 transformed CRP and relative serum Aminoadipic acid levels. The y axis represented serum Aminoadipic acid level, and the x axis represented log 2 transformed CRP. R square was 0.31, and 95% CI was −1.14 to −0.00. (C) Simple linear regression model with log 2 transformed PCT and relative serum 2-Hydroxy-3-methylbutyric acid level. The y axis represented serum 2-Hydroxy-3-methylbutyric acid level, and the x axis represented log 2 transformed PCT. R square was 0.41, and 95% CI was 0.067 to 0.58. (D) Simple linear regression model with log 2 transformed PCT and relative serum Palmitoleic acid level. The y axis represented serum Palmitoleic acid level, and the x axis represented log 2 transformed PCT. R square was 0.37, and 95% CI was −0.52 to −0.039.

