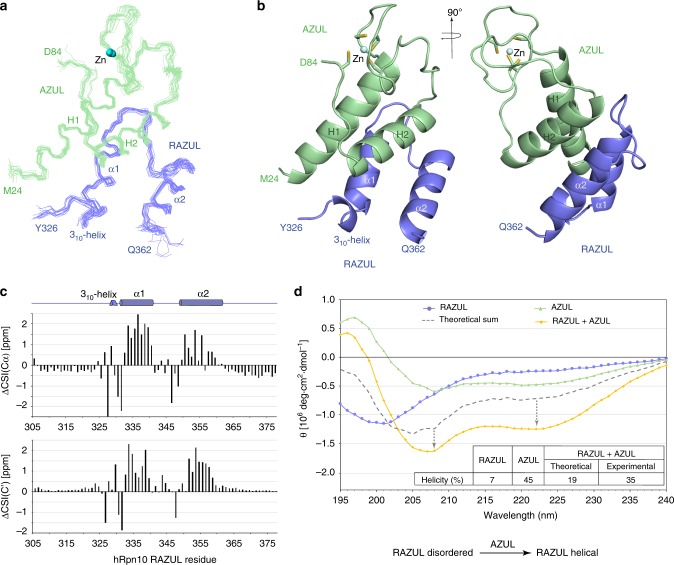
Fig. 5. AZUL induces helicity in hRpn10 RAZUL.
a Backbone trace labeling terminal residues of 15 lowest energy RAZUL (blue):AZUL (green) structures superimposing secondary structures with Zn displayed (blue sphere). Secondary structures and Zn are labeled in a, b. b Representative ribbon diagram of the RAZUL:AZUL structure with sidechain atoms of Zn-coordinating cysteines displayed as sticks with sulfur yellow. c AZUL-induced CSI change (ΔCSI) for RAZUL Cα (top) and C’ (bottom). ΔCSI(Cα) = CSI(Cαbound) − CSI(Cαfree); ΔCSI(C’) = CSI(C’bound) − CSI(C’free). d CD spectra of RAZUL (blue), AZUL (green), and the mixture (orange). The theoretical sum spectrum based on free values (gray) is displayed, with a table listing predicted helicity and schematic depicting the effect of AZUL on RAZUL structure. Source data are provided as a Source Data file.

