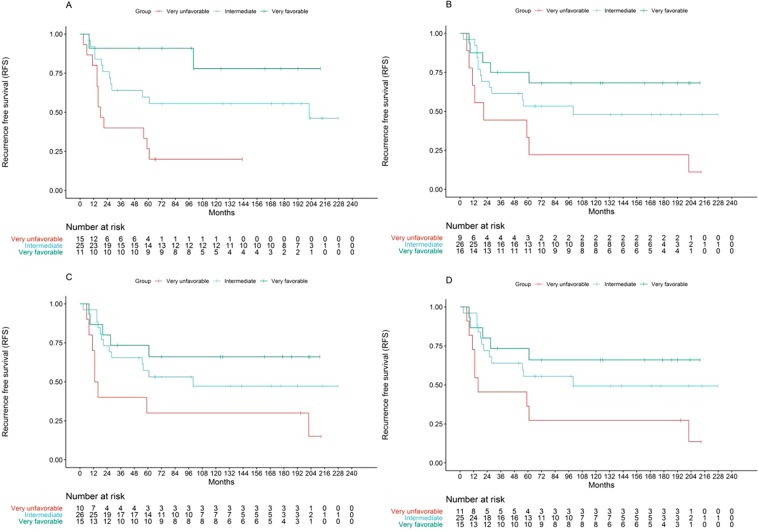
Figure 3.
Kaplan-Meier log rank Recurrence Free Survival analysis of groups generated by a composite classification rule combining miRNA profiles and pathologically assessed chemoresponse (PCR). Three groups were defined: “Very favorable” (good prognostic profile/optimal chemoresponse, top curve), “very unfavorable” (poor prognostic profile/suboptimal chemoresponse, bottom curve) and “intermediate” (good prognostic profile/suboptimal chemoresponse, or poor prognostic profile/optimal chemoresponse, middle curve). Clustering: (A) 5 miRNA-profile/PCR, Median RFS 18 vs 202 months vs not reached, p = 0.003. (B) 22 miRNA-profile/PCR, Median RFS 21 vs 100 months vs not reached, p = 0.026. Signed average: (C) 5 miRNA-profile/PCR, Median RFS 13 vs 100 months, vs not reached, p = 0.039. (D) 22 miRNA-profile/PCR, Median RFS 16 vs 100 months vs not reached, p = 0.039.

