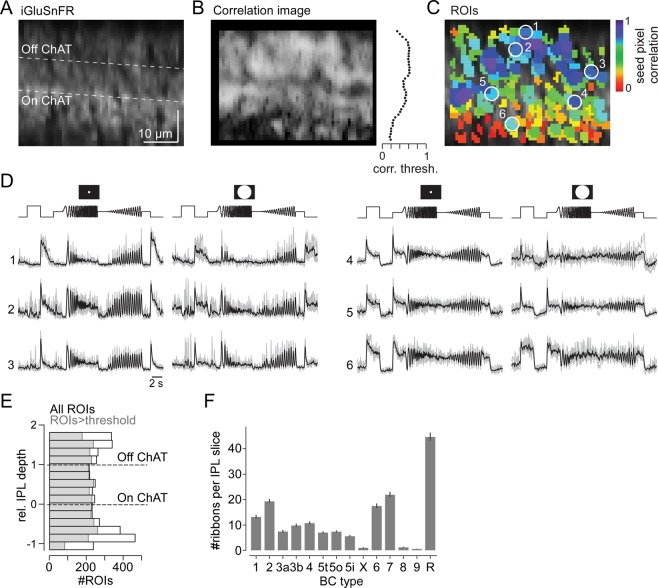
Figure 4.
Glutamate imaging in the inner plexiform layer. (A) Axial x-z scan (64 × 56 pixels, 1.6 ms/line) of the inner plexiform layer (IPL) in a whole-mount wild-type mouse retina expressing iGluSnFR ubiquitously after AAV-mediated transduction. (B) Correlation image (left) and distribution of correlation thresholds across the IPL (right). (C) ROIs extracted from scan in (A), pseudo-coloured by seed pixel correlation (for details on ROI extraction, see Methods). (D) Glutamate responses to local and global chirp stimulus for exemplary ROIs encircled in (C); Off (left) and On responses (right) are shown. (E) Distribution of all ROIs (black, n = 5,379) and ROIs that passed our quality threshold (grey, n = 3,893; Methods) recorded across the IPL (n = 6/8/37 mice/retinas/scans). (F) Number of ribbon synapses from different BC types per vertical IPL slice (Methods), estimated based on available EM data10.

