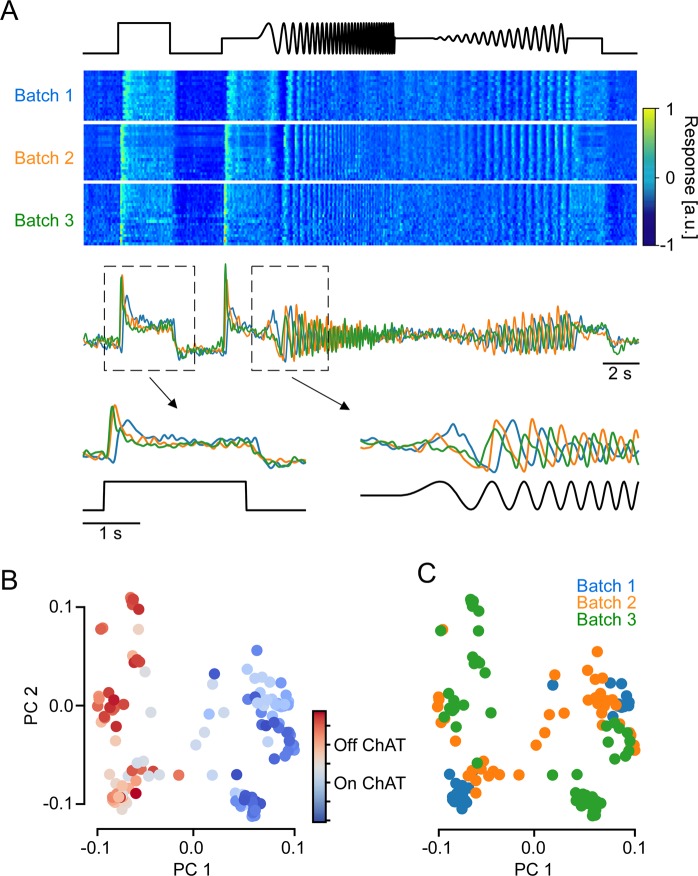
Figure 6.
Batch effects in axial x-z scans of the mouse inner plexiform layer (IPL). (A) Local chirp responses from ROIs located in the On sublamina of the IPL. From top: time course of chirp stimulus, heat map showing glutamate responses of ROIs from three scan fields (batches), average glutamate responses over ROIs in each batch, and magnified step and frequency responses. (B,C), Local chirp responses of ROIs in (A) projected onto their first two principal components (PCs), coloured by IPL depth (B) and batch (C).

