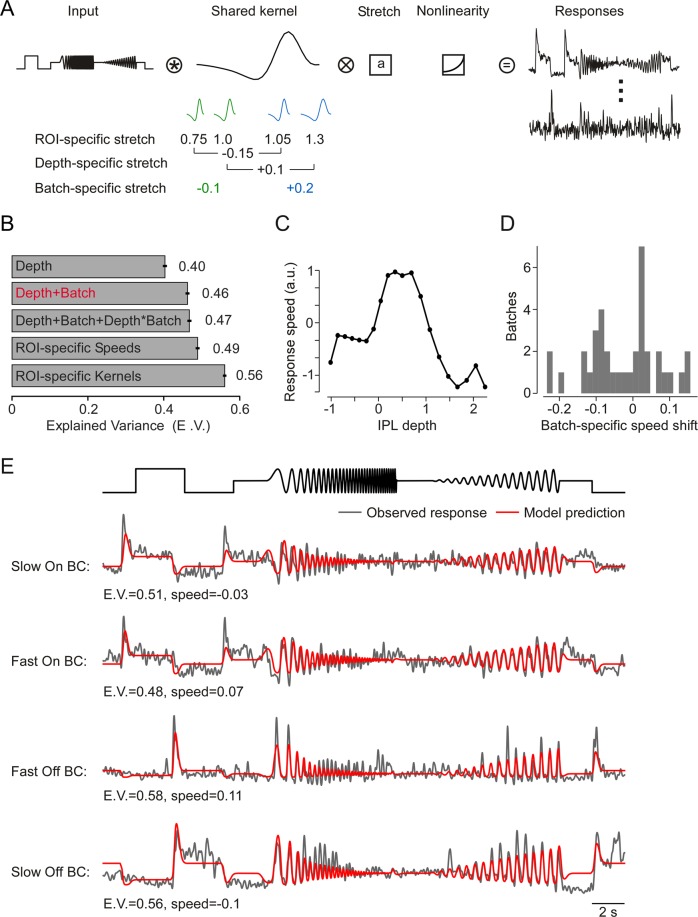
Figure 7.
Encoding model comparison. (A) Model design: the input time series of the chirp stimulus is convolved with a finite impulse response linear filter which is sign-flipped for On and Off responses and stretched by a factor that is learned for each ROI, then passed through a static nonlinearity (exponential linear unit) and weighted by each ROI to produce the predicted trace. (B) Comparison of the different speed models (Methods) learned simultaneously with the encoding model. Error bars indicate 2 S.E.M. (C) Speed as a function of IPL depth. (D) Distribution over learned batch shifts. (E) Observed (black) and predicted (red) traces for four ROIs. E.V., Explained Variance.

