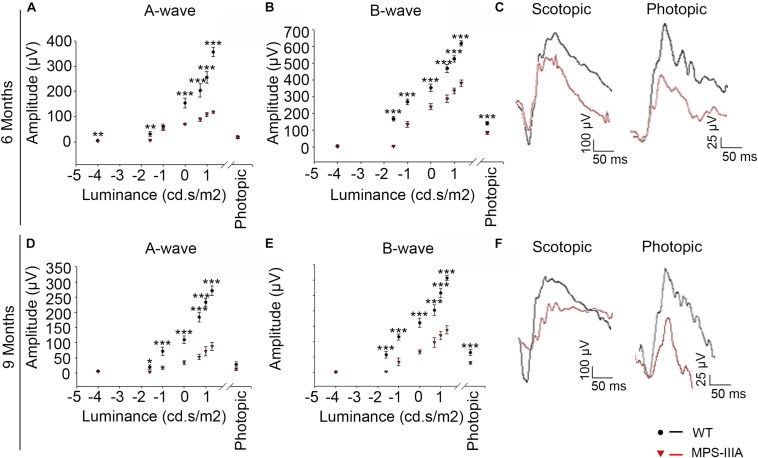
FIGURE 2.
MPS-IIIA mice show a progressive functional photoreceptor deficiency. (A,B) Representative ERG (a- and b-wave), plotted as a function of stimulus intensity, from 6 months old WT (black circle) and MPS-IIIA (red triangle) mice. Error bars represent SEM. ***p-value ≤ 0.005, **p-value ≤ 0.01 t-test. (C) Representative ERG (scotopic and photopic responses) traces of WT (black line) and MPS-IIIA (red line) mice at 6 months of age. Scotopic indicates ashes of 20.0 cd s/m2 light intensity; photopic indicates ashes of 20.0 cd s/m2 light intensity on a constant background illumination of 50 cd/m2. (D,E) Representative ERG (a- and b-wave), plotted as a function of stimulus intensity, from 9 months old WT (black circle) and MPS-IIIA (red triangle) mice. Error bars represent SEM. ***p-value ≤ 0.005, *p-value ≤ 0.05 t-test. (F) Representative ERG (scotopic and photopic responses) traces of WT (black line) and MPS-IIIA (red line) mice at 9 months of age. Scotopic indicates ashes of 20.0 cd s/m2 light intensity; photopic indicates ashes of 20.0 cd s/m2 light intensity on a constant background illumination of 50 cd/m2.

