FIGURE 5.
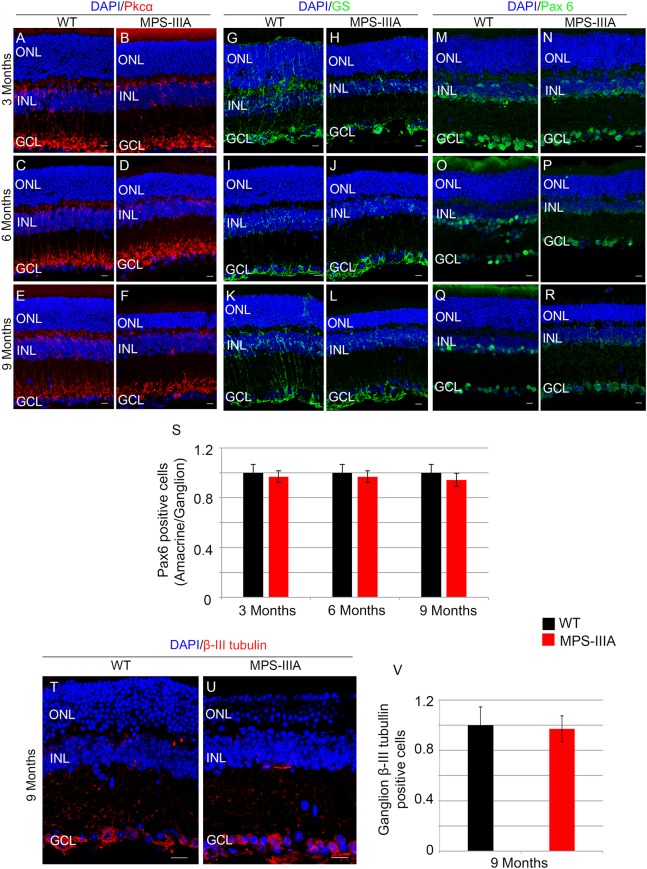
SGSH loss of function seems to induce a specific photoreceptor loss phenotype. Representative images of retina cryosections immunostained with anti-Pkcα (A–F), anti-Glutamine Synthase (GS) (G–L), and anti-Paired Box 6 (Pax 6) (M–R) antibodies from WT (A,C,E,G,I,K,M,O,Q) and MPS-IIIA (B,D,F,H,J,L,N,P,R) at 3 months (A,B,G,H,M,N), 6 months (C,D,I,J,O,P), and 9 months (E,F,K,L,Q,R) of age. Nuclei are counterstained with DAPI (blue). At least n = 6 mice per group. Scale bar 10 μm. (S) Graphs show the number of amacrine/ganglion Pax6-positive cells from the retina of WT and MPS-IIIA mice at 3-, 6-, and 9 months of age. Error bars represent SEM. Note that the number of Pax6-positive cells in MPS-IIIA did not change compared to WT mice. (T,U) Representative images of retina cryosections immunostained with anti-β-III tubulin from WT and MPS-IIIA at 9 months of age. Nuclei are counterstained with DAPI (blue). At least n = 6 mice per group. Scale bar 10 μm. ONL, outer nuclear layer; INL, inner nuclear layer; GCL, ganglion cell layer. (V) Graphs show the number of ganglion β-III tubulin-positive cells from the retina of WT and MPS-IIIA mice at 9 months of age. Error bars represent SEM. Note that the number of β-III tubulin-positive cells in MPS-IIIA did not change compared to WT mice.

