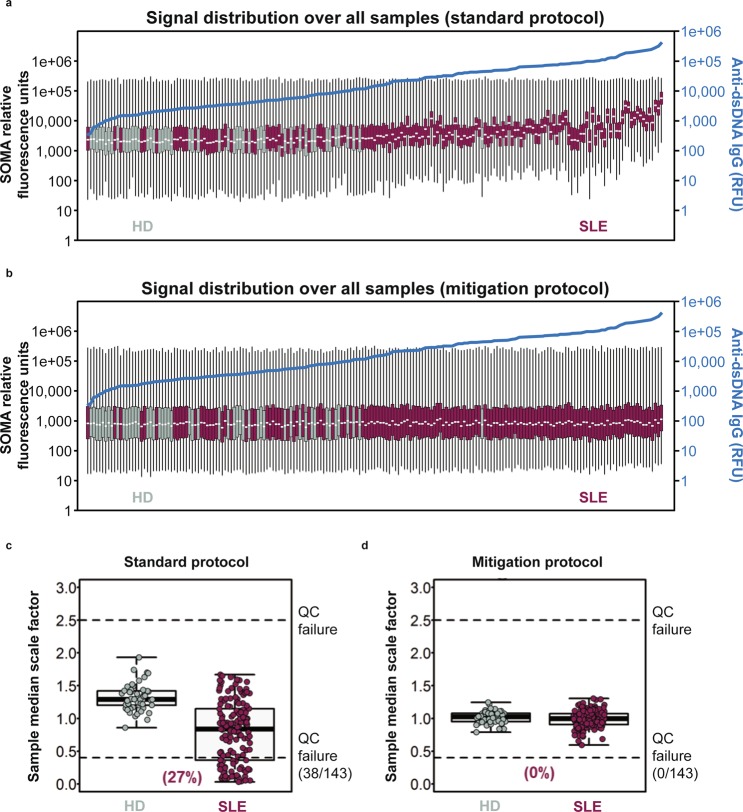
Figure 1.
Boxplots displaying global signal distribution of 1,129 protein measurements generated using (a) the standard SomaLogic protocol and (b) mitigation protocol from serum samples collected from 143 patients with systemic lupus erythematosus (SLE) and 50 healthy donors (HD). The minimum, first quartile, median, third quartile, and maximum relative fluorescence units (RFU) per sample are indicated on each boxplot. Samples are arranged in ascending order based on anti–double-stranded DNA (anti-dsDNA) immunoglobulin G (IgG) RFU. Anti-dsDNA IgG prevalence for each sample is plotted in blue. (c,d) Sample-specific median scaling factors were used for plate median normalisation in SLE and HD samples. 38 samples from patients with SLE displayed 2.5-fold increased signal relative to their intra-assay control medians, resulting in failure of SOMAscan quality control (QC) standards using the standard SOMAscan protocol. After the samples were processed with the mitigation protocol, all samples passed quality control standards with median signal intensities ranging from a 0.8- to 1.7-fold difference relative to the median assay signal intensity.

