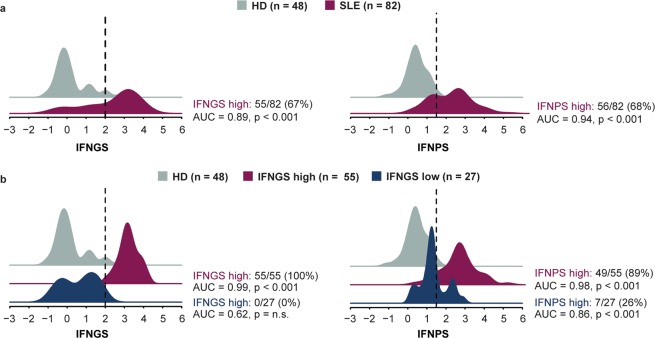
Figure 3.
(a) Density plots displaying values of interferon gene signature (IFNGS) in systemic lupus erythematosus (SLE; magenta) and healthy donors (HD; grey), and four-protein IFN signature (IFNPS) in HD (grey) and patients with SLE (magenta). (b) Values of IFNGS in HD (grey) and patients with SLE with low (blue) and high (magenta) values of IFNGS (cutoff of 2), and IFNPS values in HD (grey) and patients with SLE with low (blue) and high (magenta) IFNGS. Statistical comparisons between each group of patients with SLE and HD were reported with the area under the curve (AUC) and p-value reported from the Mann-Whitney U test.

