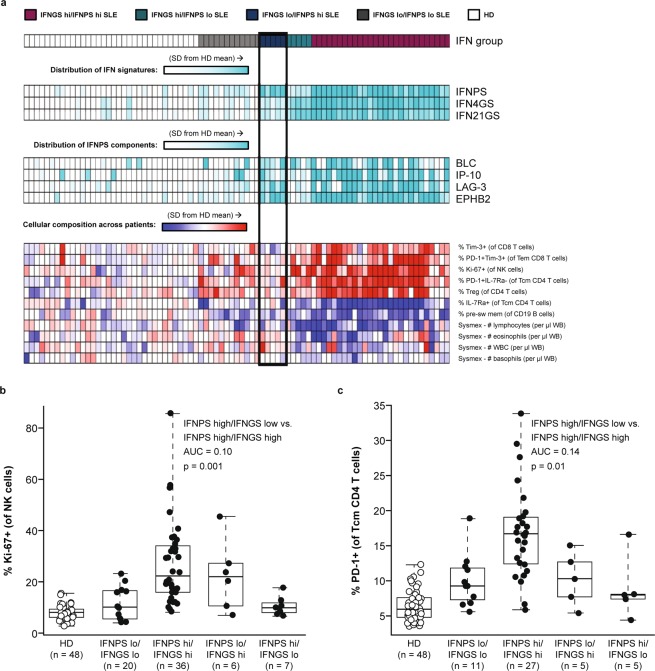
Figure 5.
(a) Heatmap displaying associations of cell populations with interferon gene signature (IFNGS) and interferon protein signature (IFNPS) in 3-way ANOVA (p < 0.05). (b,c) Boxplots displaying elevation of Ki-67+ NK cells and PD-1+ Tcm CD4 T cells in IFNGS-high patients with systemic lupus erythematosus (SLE) versus IFNPS-high/IFNGS-low patients with SLE. AUC = area under the curve, HD = healthy donors, SD = standard deviation, WB = whole blood. NK = natural killer cells, Tcm = central memory T cells, Tem = effector memory cell.

