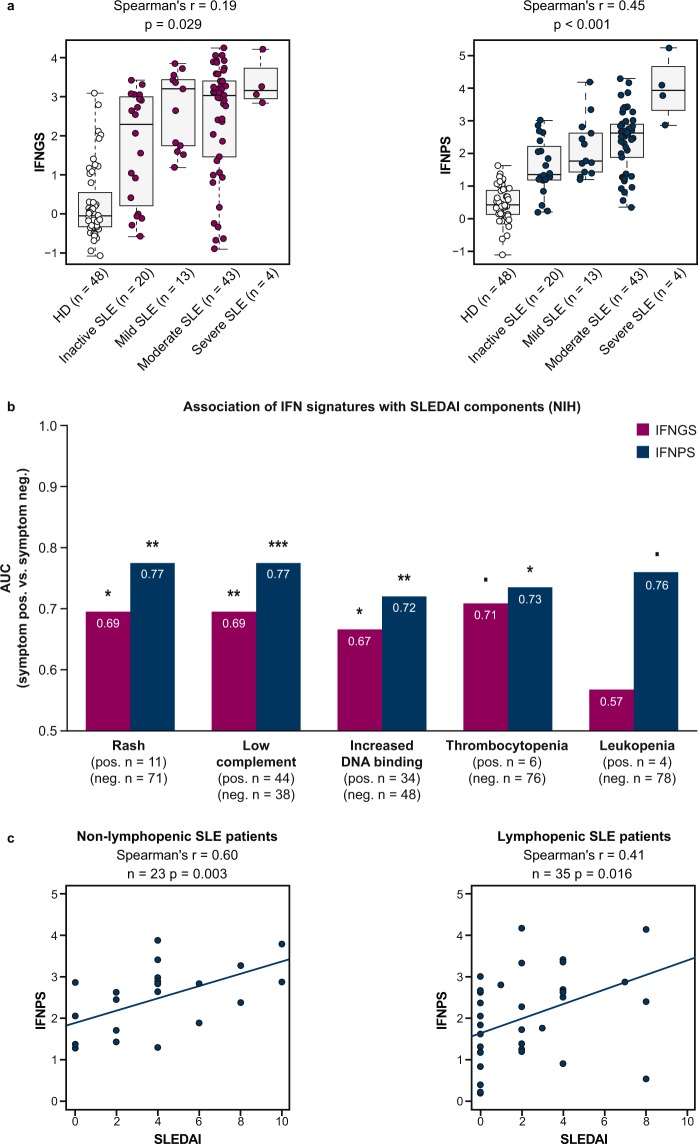
Figure 6.
(a) Boxplots displaying correlation between interferon gene signature (IFNGS) and interferon protein signature (IFNPS) with systemic lupus erythematosus (SLE) disease activity. (b) Area under the curve (AUC) of IFNGS and IFNPS in discriminating patients with SLE positive or negative for specific SLE Disease Activity Index (SLEDAI) components in the NIH lupus cohort. Threshold for leukopenia: <3,000 WBC/µl. (c) Scatterplots displaying correlation between IFNPS and SLEDAI in non-lymphopenic patients with SLE and lymphopenic patients with SLE. P-values reported using Mann-Whitney U test (***p < 0.001, **p < 0.01, *p < 0.05, ▪p < 0.10). HD = healthy donors.

