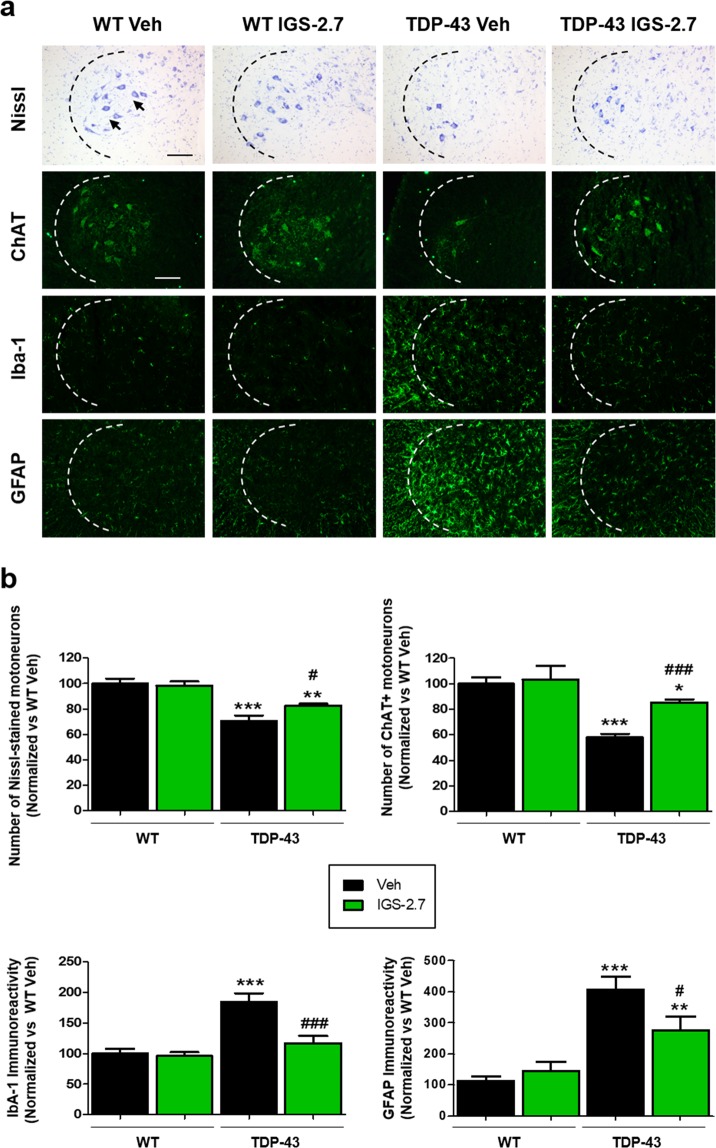
Figure 2.
Photomicrographs of histological samples in the anterior horn of the spinal cord of TDP-43 mice and wild-type controls. (a) Representative images of Nissl staining of motor neurons (black arrows), ChAT, Iba-1 and GFAP immunostained sections (b) Quantification of the different markers. Total average number of motor neurons (Nissl, ChAT+), microglia (Iba-1+) and astrocytes (GFAP+) is shown. Data are expressed as a percentage over the WT-Veh group. Values are expressed as means ± SEM, N ≥ 6 in each group. Data were assessed by one-way ANOVA followed by the Bonferroni test (*p < 0.05, **p < 0.01, ***p < 0.001 vs. WT-Veh group; #p < 0.05, ##p < 0.01, ###p < 0.001 vs. TDP-43-Veh). Scale bars = 200 μm.

