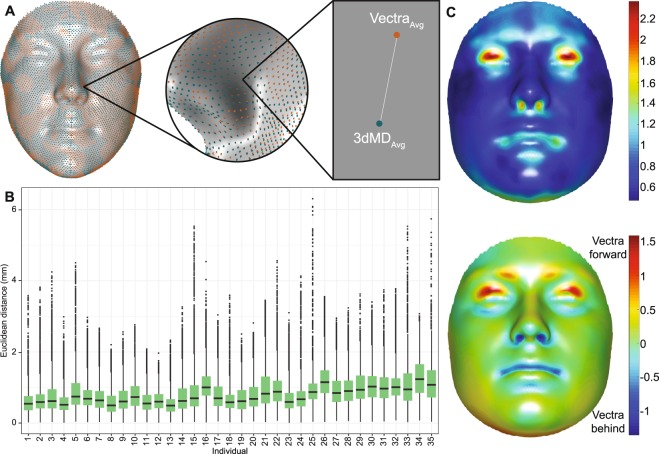
Figure 4.
Camera error for participants. (A) To calculate the camera error for each person, all quasi-landmark configurations for each camera were averaged (3dMDAvg and VectraAvg) and aligned using a non-scaled, non-reflected GPA. The camera error was estimated by calculating the distance between the average 3dMDface configuration and the average Vectra H1 configuration. This process was repeated across all 7,160 quasi-landmarks. (B) Boxplots of camera error for all participants. (C) Top: Distribution of camera error across the face, calculated by averaging the Euclidean distance values (mm) per quasi-landmark over the 35 participants. Bottom: Distribution of displacement along the normal vectors across the face, going from the 3dMDface image to the Vectra H1 image, after GPA alignment. Red values are those where the direction of the vector is positive, indicating that the Vectra H1 image is more outwardly displaced relative to the 3dMDface image. Blue values are those where the direction of the vector is negative, indicating that the Vectra H1 image is inwardly displaced or recessed relative to the 3dMDface image. Values have been averaged across all 35 participants and are unit-less.

