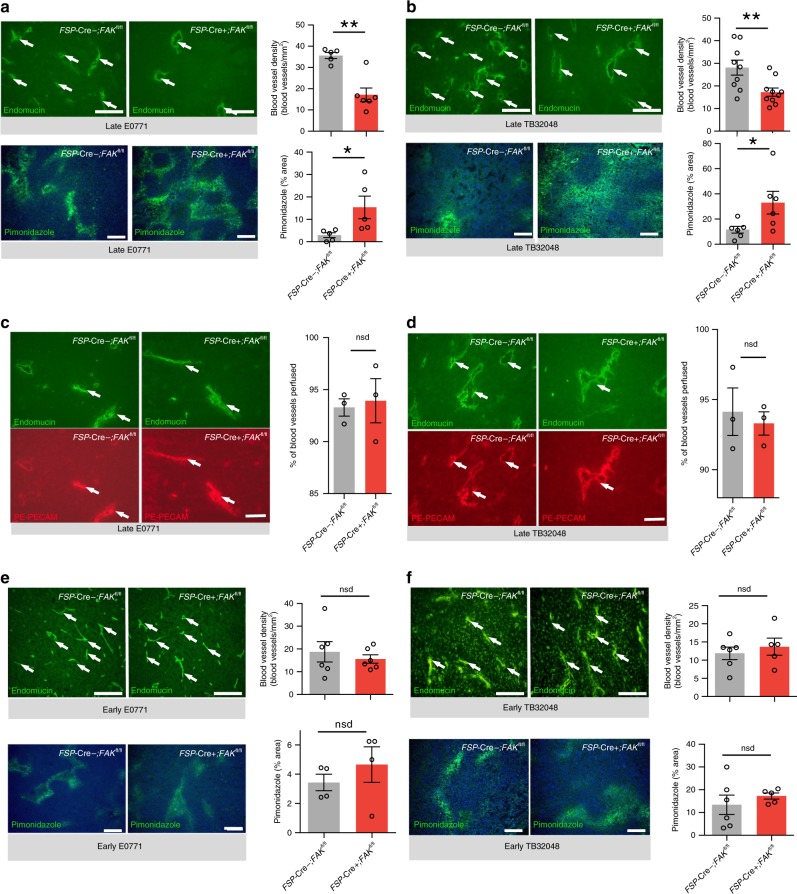
Fig. 2. Depletion of CAF-FAK reduces tumour blood vessel density in late stage tumours.
Histological analysis of blood vessel density and hypoxia in size-matched, age-matched late stage a E0771 (day 34) and b TB32048 (Day 33) tumours grown in FSP-Cre+; FAKfl/fl and FSP-Cre−; FAKfl/fl mice. Tumours were sectioned and immunostained for either endomucin or pimonidazole and the number of blood vessels or relative areas of hypoxia quantified across whole-tumour sections. A significant reduction in blood vessel density and increase in hypoxia were observed in late-stage tumours from FSP-Cre+; FAKfl/fl mice. Bar charts show quantitation of mean blood vessel density per mm2 ± s.e.m. and mean pimonidazole positive area fraction ± s.e.m (n = 5 (E0771) and 9 (TB32048) FSP-Cre−; FAKfl/fl and 6 (E0771) and 10 (TB32048) FSP-Cre+; FAKfl/fl tumours, for endomucin; n = 5 FSP-Cre−; FAKfl/fl and FSP-Cre+; FAKfl/fl E0771 tumours and 6 FSP-Cre−; FAKfl/fl and 5 FSP-Cre+; FAKfl/fl TB32048 tumours, for pimonidazole). c, d Blood vessel perfusion was measured by calculating the percentage of endomucin-positive blood vessels that were PE-PECAM positive. The functionality of tumour blood vessels was assessed by immunofluorescence staining of endomucin in mice perfused with PE-PECAM antibody on late-stage c E0771 breast and d TB32048 pancreatic tumour sections. The percentage of perfused blood vessels was not different between the two genotypes. Bar charts show mean percentage of perfused vessels (double positive) over total number of blood vessels (endomucin positive). n = 3 tumours from FSP-Cre−;FAKfl/fl and 3 tumours from FSP-Cre+;FAKfl/fl mice. Arrows, representative perfused vessels. Green: endomucin, red: PE-PECAM. Bar chart in c and d represents mean % perfused blood vessels ± s.e.m; two-sided Student’s t-test. nsd no significant difference. Scale bars, 25 μm. e, f Before tumour growth diverged significantly between genotypes, early stage, size-matched E0771 breast (day 21) and TB32048 pancreatic (day 21) tumours were also analysed for tumour angiogenesis (E0771: n = 6 tumours/genotype; TB32048: n = 6 tumours from FSP-Cre−;FAKfl/fl and 5 tumours from FSP-Cre+;FAKfl/fl mice) and hypoxia (E0771: n = 4 tumours/genotype; TB32048: n = 6 tumours from FSP-Cre−;FAKfl/fl and 5 tumours from FSP-Cre+;FAKfl/fl mice) as above. No changes in blood vessel density or hypoxia were detected at this early stage of tumour growth. Bar chart in e and f shows mean blood vessel density per mm2 ± s.e.m. Scale bars in a, b, e, f for endomucin, 25 μm; pimonidazole, 200 μm. For a and b, *P < 0.05, **P < 0.01. nsd, no significant difference. Statistical analysis, two-sided Student’s t-test.

