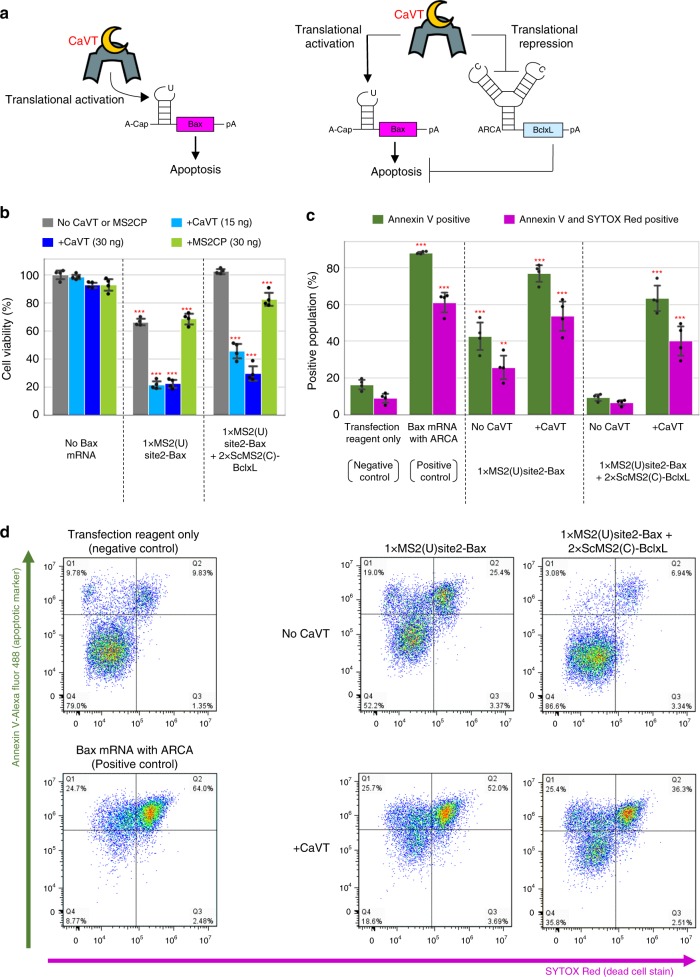
Fig. 5. Apoptosis regulation by CaVT-mediated translational activation and repression.
a Schematic diagrams of apoptosis-regulating circuits. Apoptosis is induced by only the translational activation of Bax (left) or both the translational activation of Bax and translational repression of Bcl-xL (right). b The viability of cells transfected with apoptosis-regulating circuits. HeLa cells were co-transfected with 1xMS2(U)site2-Bax (cap analog: A-cap), 2xScMS2(C)-BclxL (cap analog: ARCA), and CaVT or MS2CP mRNAs. All mRNAs contained N1mΨ. Cell viability was analyzed by the WST-1 assay. The bar graph shows the means ± SD. (n = 4 independent wells in each transfection condition). ***P < 0.001 compared to no Bax mRNA/no CaVT or MS2CP samples by ANOVA with Dunnett’s multiple comparison test (two-sided). Exact P values are shown in Supplementary Table 1. Source data are provided as a Source Data file. c, d Annexin V (apoptosis marker) and SYTOX Red (dead cell marker) staining. HeLa cells were co-transfected with 1xMS2(U)site2-Bax mRNA (cap analog: A-cap), 2xScMS2(C)-BclxL mRNA (cap analog: ARCA), and CaVT mRNA. For the positive control, 1xMS2(U)site2-Bax mRNA (cap analog: ARCA) was transfected. All mRNAs contained N1mΨ. One day after the transfection, the cells were stained and analyzed by a flow cytometer. The bar graph shows the average of four independent experiments (mean ± SD) (c). Representative two-dimensional dot plots (d). **P < 0.01, ***P < 0.001 compared to the negative control by ANOVA with Dunnett’s multiple comparison test (two-sided). Exact P values are shown in Supplementary Table 1. Source data are provided as a Source Data file.

