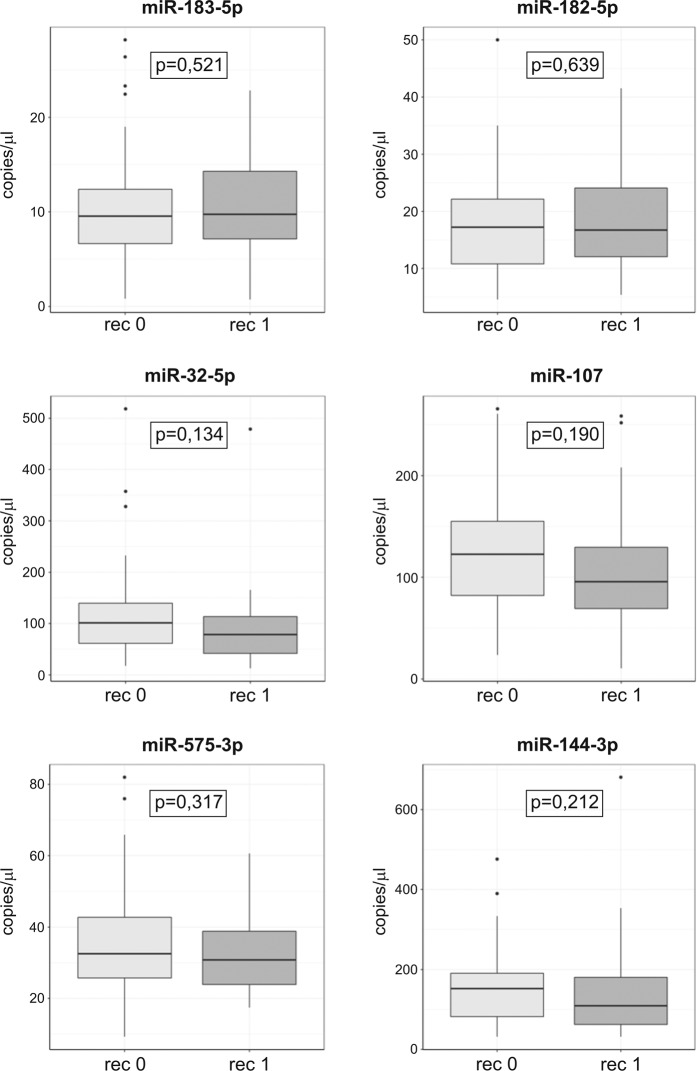
Figure 1.
Serum levels of selected miRNAs validated by ddPCR.Box plots show the levels of miRNAs (in copies per microliter of serum). The bottom and top of each box presents the 1st and 3rd quartiles of the data, respectively. The median is presented as a solid line across the box. Dots represent outliers. The distribution of variables between groups was compared using Student’s t-test for normally distributed variables and the Mann-Whitney test otherwise. rec 0 -patients without AF recurrence (n = 52); rec 1 - patients with AF recurrence (n = 38).

