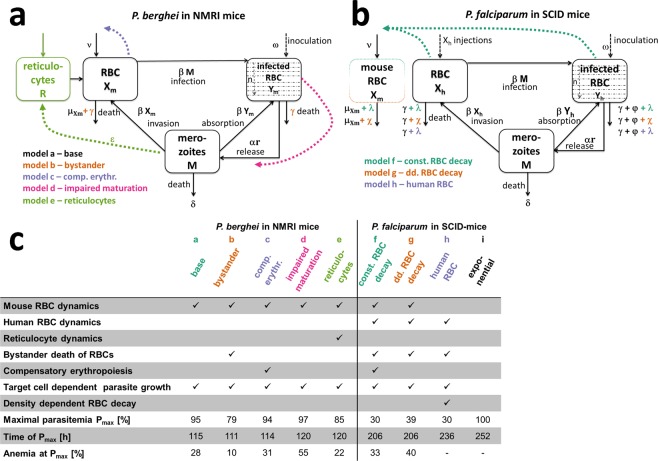
Figure 1.
Schematic representations of the mechanistic within-host parasite growth models for P. berghei (a) and P. falciparum (b), with summary model details (c). The base model by16 is represented in black with model modifications added in color, for all models erythrocytic parasite stage was split into n age compartments (n = 12). Model a to e for P. berghei mainly capture processes dictated by the host-parasite system such as reactions of the host to increasing infection in model b (bystander)) and model c (comp. erythr.), changes in parasite dynamics over the course of infection model d (impaired maturation), and host cell preferences of the parasite model e (reticulocyte). In turn, model f to h for P. falciparum dynamics are primarily influenced by the experimental set-up of continued human RBC injections. Whereas model f (const. RBC decay) and g (dd. RBC decay) additionally explicitly model mouse RBCs, model h (human RBC) only captures human RBC populations. RBC or parasite transitions are represented with solid lines and influencing processes with colored dashed lines. (c) Selected index numbers characterizing the growth of parasites in the respective mechanistic mouse models for the experiment shown in Fig. 3. Anemia is defined as the percentage of RBCs compared to values prior to infection.

