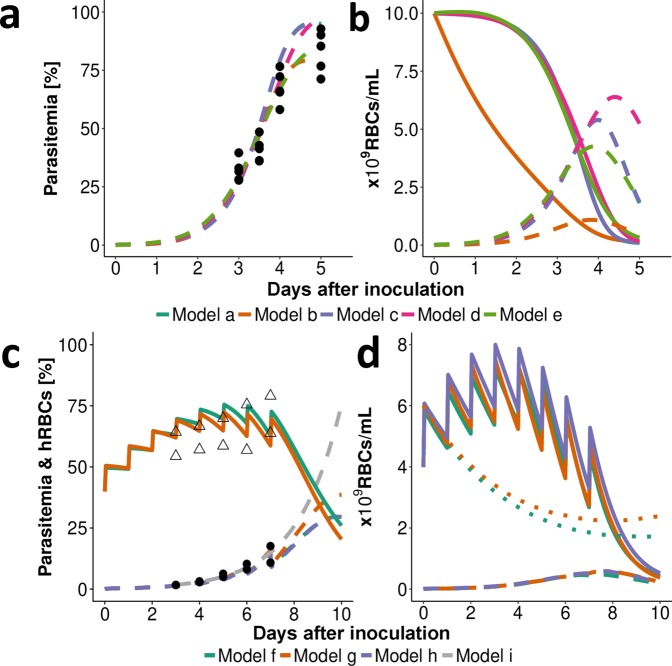
Figure 3.
Representative fit of the within-host models to data. (a) Data (•) and model predictions (- -) of infection with P. berghei with an inoculum of 2 × 10⁷ infected RBCs (i.v.) show a steep increase in parasitemia three days after inoculation. (b) Model output for unobserved total numbers of RBCs show an increase in infected RBCs (- -) with a simultaneous decrease in uninfected RBCs (▬) resulting in anemia. However, the total number of human and murine RBC populations differs between model predictions (compare model b (bystander)), given that the estimated percentage of infected RBCs is compared to observed. Further differences in models become apparent comparing predicted time of, and total parasite numbers at, peak parasitemia Pmax (see Fig. 1c). (c) Infection of SCID mice with P. falciparum through an inoculum of 3.5 × 10⁷ infected RBCs (i.v.). Human RBCs (∆) are injected daily until day seven post-infection increasing total human RBC counts (▬). (d) As uninfected RBCs (▬) increase the predicted number of mouse RBCs (• •) decrease due to random clearance of excess RBCs. After RBC injections are ceased, the model predicts a steep decline in human RBCs. Data (•) and models f to h (- -) show lower values of predicted peak parasitemia compared to model i.

