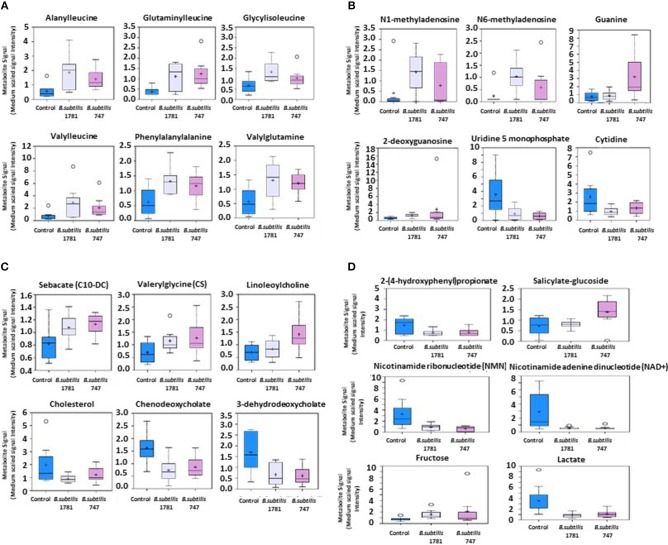
Figure 2.
Box-and-whisker plots of the levels of (A) amino acids, (B) nucleotides, (C) fatty acids, and (D) others, including xenobiotics, vitamins, cofactors, and carbohydrates in the intestine of chickens fed an unsupplemented control diet (blue), or a diet supplemented with B. subtilis 1781 (gray) or B. subtilis 747 (pink). The boxes represent the interquartile range (IQR) defined by the 25th and 75th percentiles. The horizontal line represents the median value. The cross represents the mean value. The upper whisker represents Q3 + (1.5 × IQR), while the lower whisker represents Q1 – (1.5 × IQR). Circles represent outliers.

