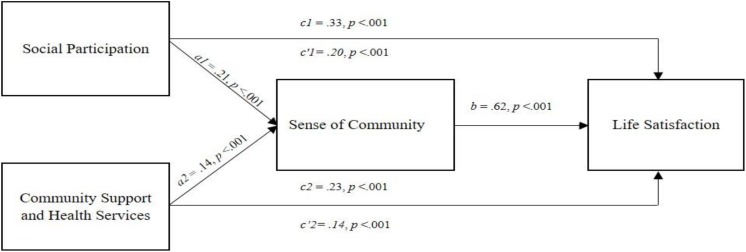
FIGURE 1.
Path diagram of the relations between AFC domains (Social Participation, Community Support and Health Services), Sense of Community, and Satisfaction with Life for the overall sample with a, b, c, and c′ denoting regression coefficients, c denoting total effect, and c′ denoting direct effect.

