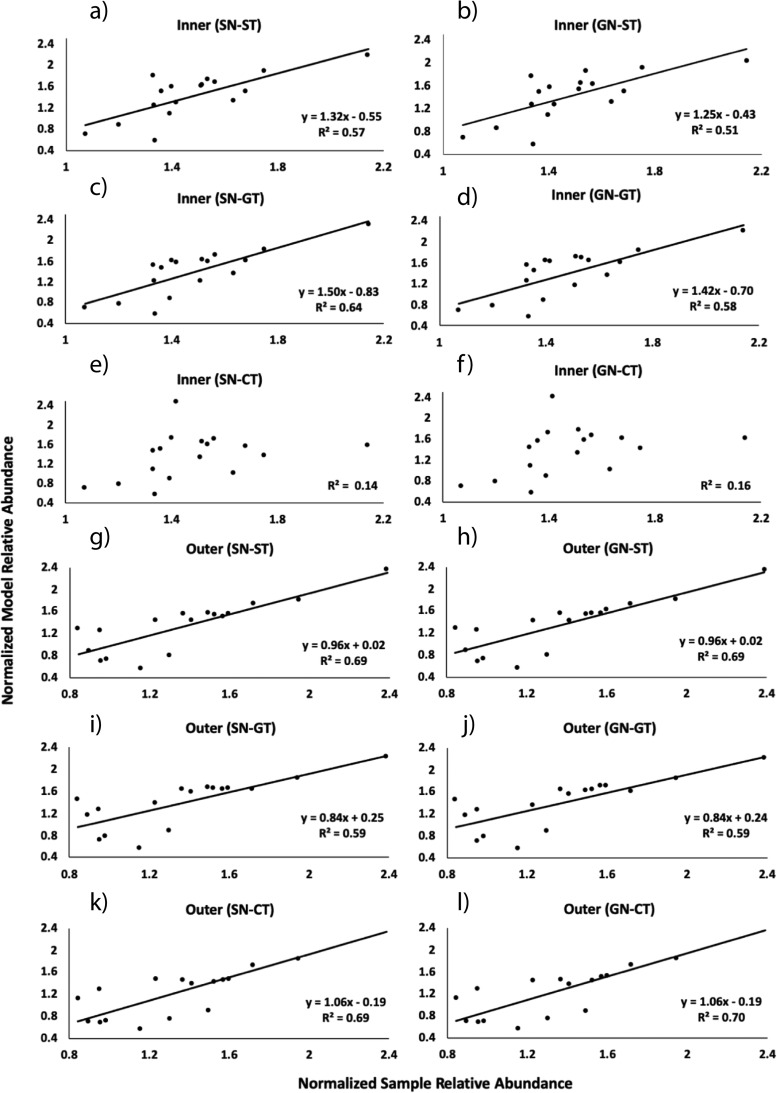
FIG 5.
Linear regression analysis between sample and model data based on fourth-root transformed relative abundances. The sample data corresponds to the most abundant microbial classes (n = 17, average abundance >1%) in the metagenomes sequenced from surface mucus layer of the coral P. strigosa (n = 12 colonies; 6 per reef zone). The model abundances of these same classes were generated by the mathematical model for both inner (a to f) and outer reefs (g to l) using six different scenarios. The solid lines represent significant linear regressions (ANOVA, P < 0.05).

