FIG 1.
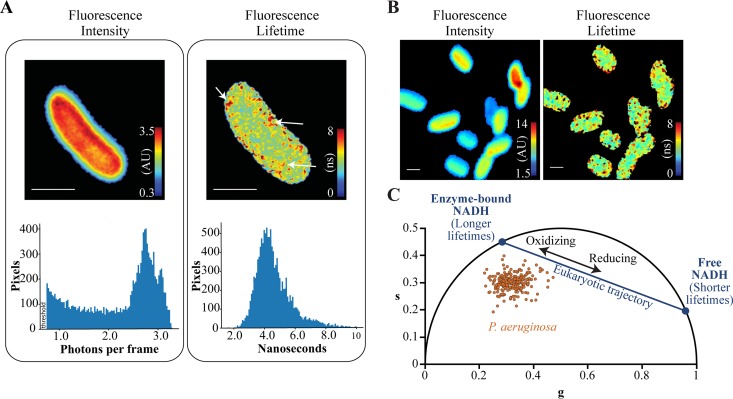
Metabolic profiling of live planktonic P. aeruginosa cells using fluorescence lifetime imaging microscopy. (A) Fluorescence intensities (in arbitrary units [AU]) and fluorescence lifetimes (in nanoseconds) of an unlabeled P. aeruginosa cell imaged using the NADH emission spectrum. The corresponding fluorescence intensity and lifetime histograms are displayed below the images. Arrows indicate clusters with relatively long fluorescence lifetimes. Bars, 1 μm. (B) Fluorescence intensities and lifetimes of multiple P. aeruginosa cells. Bars, 1 μm. (C) Phasor plot in which the cosine and sine components of the fluorescence lifetime are transformed into g and s coordinates, respectively. Each dot represents the fluorescence lifetime averaged over an individual P. aeruginosa cell. The metabolic trajectory of eukaryotic cells is plotted for reference using lifetime values of 0.4 ns and 3.4 ns for free and protein-bound NADH, respectively. Planktonic P. aeruginosa from three independent experiments were cultured to early exponential phase in modified minimal medium containing 0.2% citrate as the carbon source.

