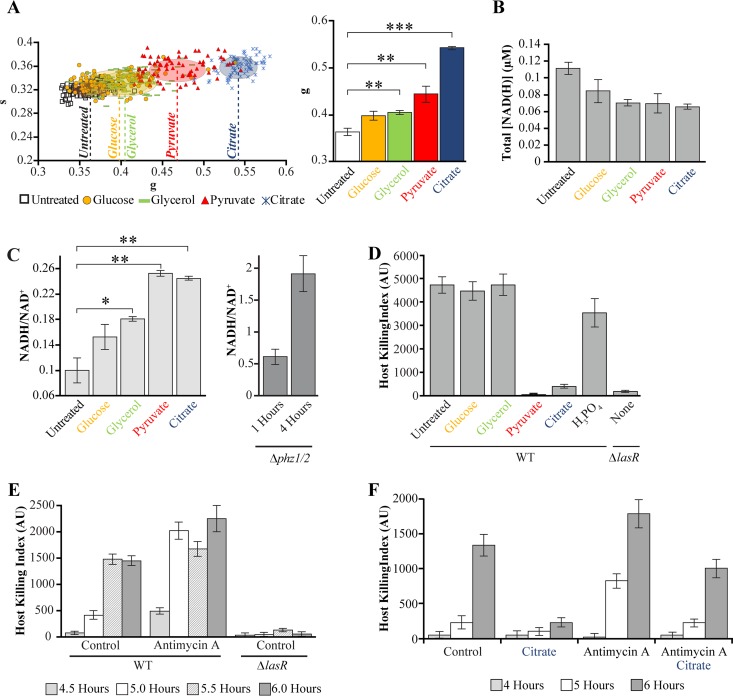
FIG 5.
Perturbing central metabolism inhibits or induces earlier activation of virulence. (A) Fluorescence lifetime phasor plot (left) and g values (right) of surface-attached P. aeruginosa cultured in rich (PS:DB) medium, supplemented with carbon sources at 0.2% concentration at 3 h following dilution, and harvested after an additional hour of growth. Each data point represents the value for a single P. aeruginosa cell. The center and axis length of each ellipse corresponds to the mean and standard deviation, respectively, of all cells pooled from three independent experiments. The bars and error bars in the bar graph indicate the means and standard errors of the means of three independent experiments, respectively. (B and C) Total NADH and NAD+ concentrations (B) and corresponding NADH/NAD+ ratios (C) for surface-attached P. aeruginosa cultured under conditions identical to those in panel A. (D) Host killing indexes for surface-attached wild-type or ΔlasR P. aeruginosa assessed after 6 h of growth. Wild-type cultures were supplemented after 3 h of growth with individual carbon sources or phosphoric acid, at 0.2% concentration. Bars are the averages for three independent experiments, and error bars represent standard deviations. (E) Host killing indexes of wild-type or ΔlasR surface-attached P. aeruginosa at 4.5 to 6 h of growth following treatment at 3 h with 0.1% ethanol (control) or 10 μM antimycin A dissolved in 0.1% ethanol. (F) Host killing indexes of wild-type surface-attached P. aeruginosa following treatment at 3 h with 0.1% ethanol (control), 0.2% citrate, 10 μM antimycin A dissolved in 0.1% ethanol, or with 0.2% citrate and 10 μM antimycin A dissolved in 0.1% ethanol. All P. aeruginosa cells were cultured in rich (PS:DB) medium. Values that are significantly different are indicated by bars and asterisks as follows: *, P < 0.05; **, P < 0.01; ***, P < 0.001. Full statistical details are given in Table S1 in the supplemental material.

