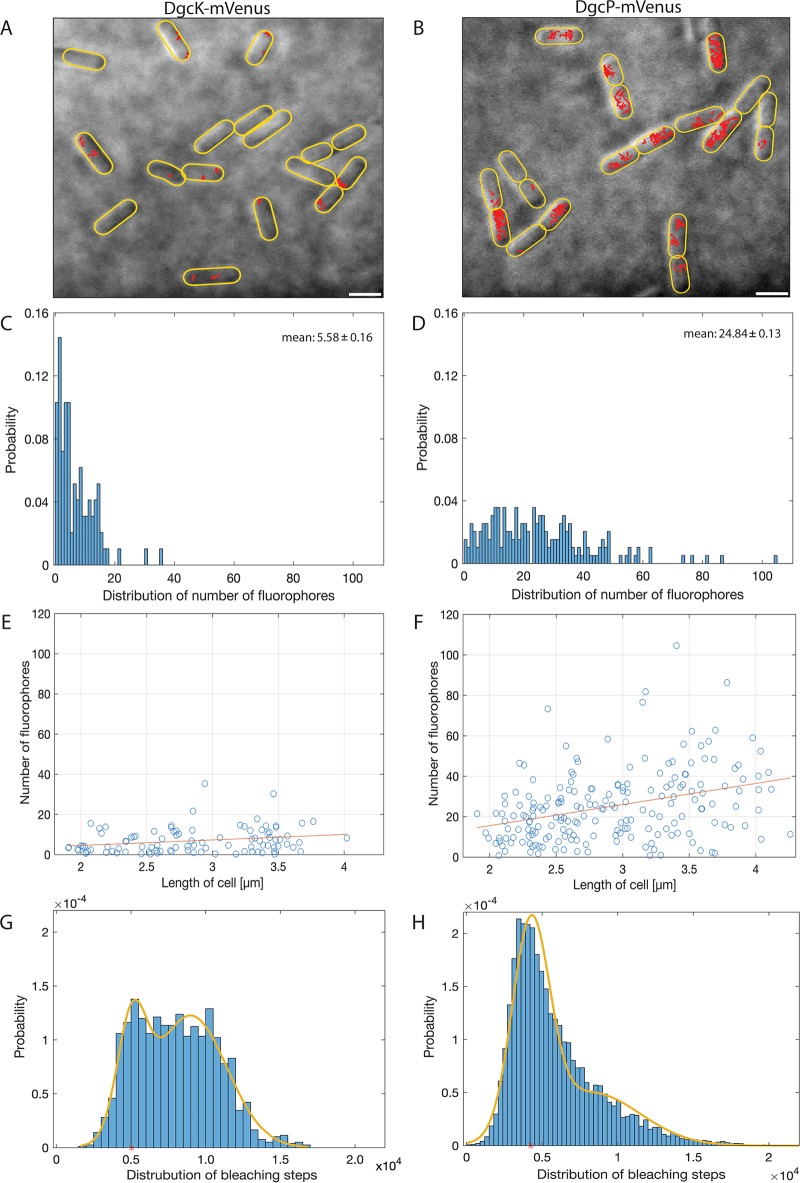
FIG 8.
Molecule numbers. (A, B) Projection of tracks in exponentially growing B. subtilis NCIB 3610 wild-type cells onto bright-field images. All tracks of DgcK-mVenus (A) and DgcP-mVenus (B) are shown in red in their respective cells. Scale bars, 2 μm. (C, D) Distribution of the number of fluorophores per cell in exponentially growing cells. Cells expressing DgcK-mVenus (C) harbor on average 5.58 ± 0.16 fluorophores per cell, whereas cells expressing dgcP-mVenus (D) show 24.84 ± 0.13 fluorophores per cell. (E, F) Correlation between the number of fluorophores and cell length. For DgcK-mVenus cells (E) there is no correlation between the number of fluorophores and cell size, but a slight correlation can be seen for DgcP-mVenus (F). (G, H) The distributions of bleaching steps for DgcK-mVenus (G) and DgcP-mVenus (H) display two fractions of bleaching steps (monomers and dimers).

