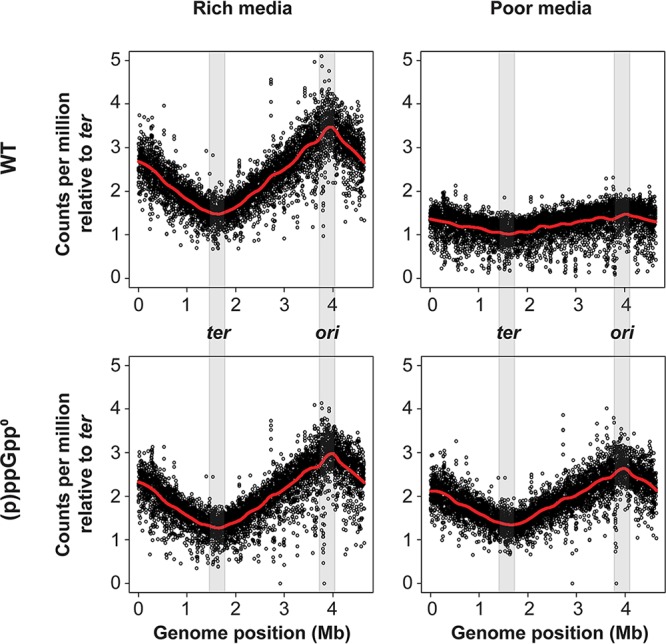
FIG 2.

Next-generation sequencing (NGS) profiles for WT and (p)ppGpp-deficient strains. Strains were grown in rich medium (LB) or poor medium (M9 with the Σ set and 0.2% glucose). The total read count was corrected per million reads and normalized to the number of ter region reads. Both the ori and ter regions are shaded in gray. Locally estimated scatterplot smoothing (LOESS) regression curves are shown in red.
