FIG 5.
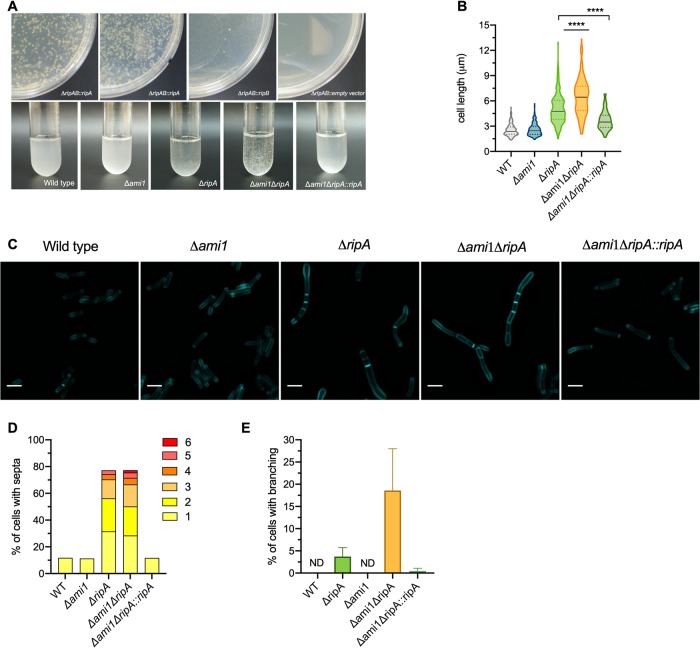
Deletion of ami1 amplifies cell division defects in the ΔripA mutant. (A) Agar plates of allelic switching transformations in the Δami1 ΔripAB::ripAB strain (top) and photographs of liquid cultures (bottom). (B) Violin plots of cell lengths for WT (n = 189) and Δami1 (n = 187), ΔripA (n = 196), ΔripA::ripA (n = 143), Δami1 ΔripA (n = 214), and Δami1 ΔripA::ripA (n = 172) mutants. The black line represents the median; the area between the dashed lines is the interquartile range. Significance was determined by a Kruskal-Wallis test; ****, P < 0.0001. (C) Micrographs of cells labeled with HADA for 20 h. Bar, 2 μm. (D) Quantification of the proportion of cells with at least one septum. The bar height represents the percentage of cells that contain 1 or more septa. The colored segments within the bars represent the proportions of cells with different numbers of septa. WT (n = 195); Δami1 (n = 380), ΔripA (n = 206), ΔripA::ripA (n = 314), Δami1 ΔripA (n = 225), and Δami1 ΔripA::ripA (n = 317) mutants. (E) Proportion of cells with branching. ND, none detected. Data in panels B to E are representative of two independent experiments.

