
FIGURE 5.
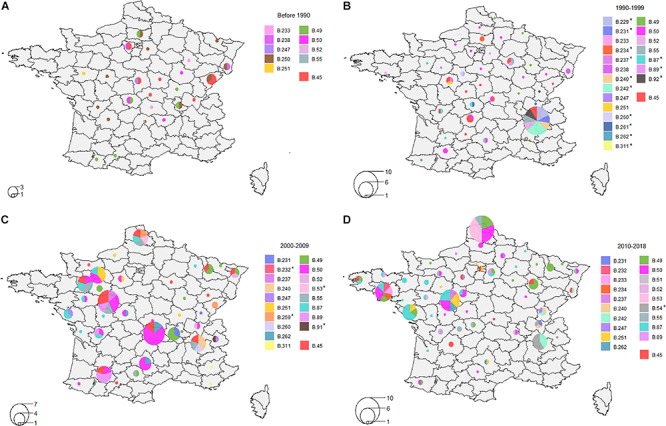
Distribution of clades on order of discrimination D4. (A) Distribution between 1947 and 1989; (B) Distribution between 1990 and 1999; (C) Distribution between 2000 and 2009; (D) Distribution between 2010 and 2018. Clades marked with a star indicate clades that were not present before this period.