
Figure 2.
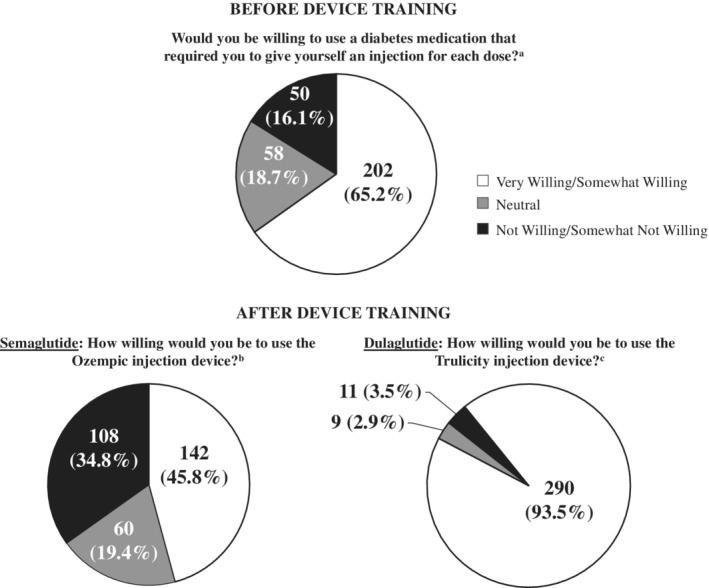
Willingness to use injection devices (N = 310) a Willing includes “somewhat willing” (34.5%) and “very willing” (30.6%); Not willing includes “somewhat not willing” (6.5%) and “not willing” (9.7%). b Willing includes “somewhat willing” (32.6%) and “very willing” (13.2%); Not willing includes “somewhat not willing” (18.7%) and “not willing” (16.1%). c Willing includes “somewhat willing” (19.7%) and “very willing” (73.9%); Not willing includes “somewhat not willing” (2.3%) and “not willing” (1.3%)