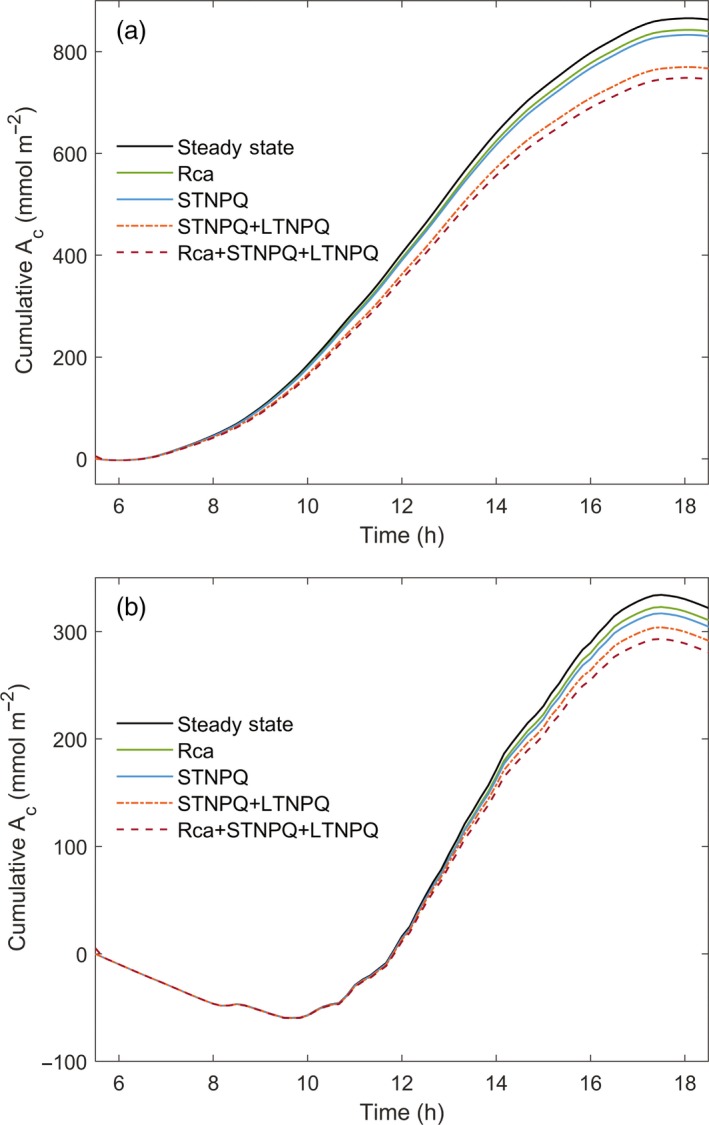
Figure 3.

The cumulative net CO2 assimilation of the Glycine max (soybean) canopy of Figure 1 (Ac) on the simulated sunny day (Figure 2a) and actual cloudy day (Figure 2b). The black line is the predicted assimilation of CO2 that would occur if photosynthesis responded instantaneously to changes in light, with no lags in efficiency. Rca accounts for the losses that result from the lags in the activation of Rubisco on shade–sun transitions. STNPQ accounts for the losses that result from lags in the both forms of NPQ. Rca + STNPQ + LTNPQ accounts for lags in both Rubisco activation and relaxation of NPQ. The simulations starts at dawn (05:30 h), with A c = 0.
