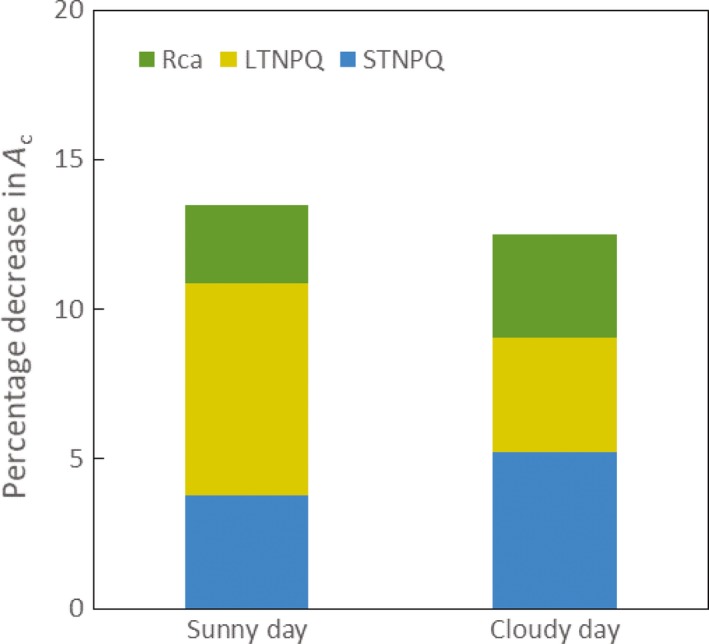
Figure 4.

The percentage loss in potential daily canopy photosynthetic net carbon assimilation (Ac) through losses of efficiency from lags in non‐photochemical quenching (NPQ) relaxation and Rubisco activation, calculated from the simulation presented in Figure 3. Blue bars (STNPQ) are the decreases in Ac caused by short‐term NPQ relaxation; yellow bars (LTNPQ) are the decreases of Ac caused by long‐term NPQ relaxation (Zhu et al., 2004); green bars (Rca) are the predicted decreases of Ac resulting from lags in Rubisco activation. The simulated sunny clear‐sky day is plotted on the left and the intermittently cloudy day is plotted on the right.
