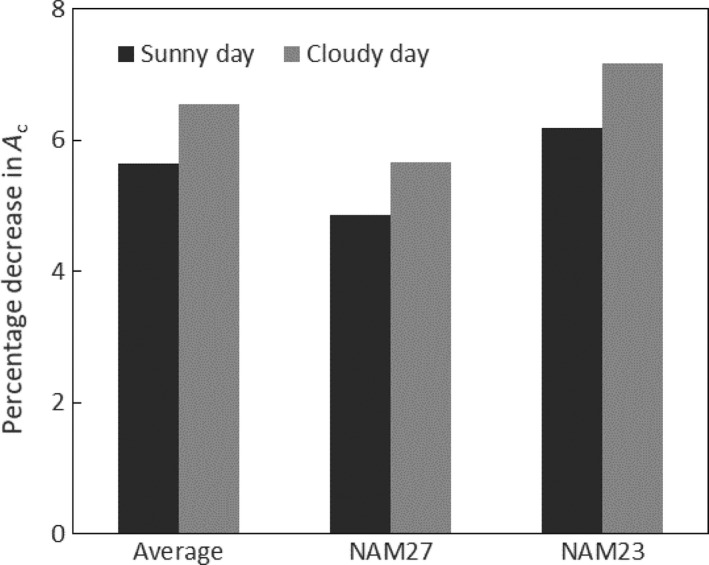
Figure 5.

The effect of genetic variation in the speeds of short‐term non‐photochemical quenching (STNPQ) relaxation on losses of potential daily net CO2 assimilation (A c) in the Glycine max (soybean) canopy of Figure 1. Illustrated are losses in A c resulting from the average of the measured rates of relaxation of STNPQ for the nested association mapping (NAM) soybean parent population and for the NAM lines showing the fastest (NAM27) and slowest (NAM23) rates of STNPQ relaxation. Dark‐gray bars are losses predicted for the sunny day (Figure 2a) and light‐gray bars are losses for the intermittantly cloudy day (Figure 2b).
