Figure 2.

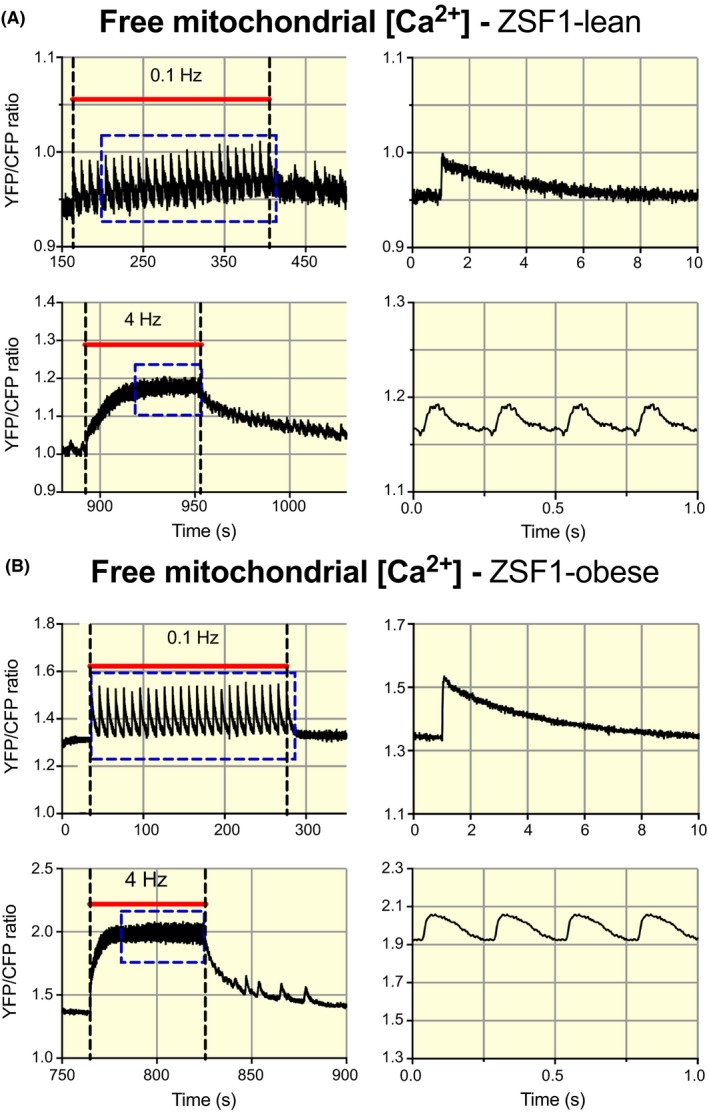
Frequency‐dependent alterations in mitochondrial Ca2+ handling in cardiomyocytes from the ZSF1‐lean and ZSF1‐obese group. A, Recordings of free mitochondrial Ca2+ concentration (Yellow fluorescent protein, YFP/chromatic Focus Probe, CFP ratio) obtained from a cardiomyocyte in the ZSF1‐lean group, stimulated during the periods indicated by the red bars at 0.1 and 4 Hz. The right column shows the corresponding averaged recordings indicated by the blue rectangles. The traces were obtained from a series of consecutive measurements 0.1, 1, 2 and 4 Hz, with 120 s pauses in between. B, Similar recordings obtained from a cardiomyocyte in the ZSF1‐obese group. An increase in mitochondrial Ca2+ concentration at baseline and marked increase in the amplitude of the beat‐to‐beat changes in mitochondrial Ca2+ concentration can be observed in ZSF1‐obese relative to ZSF1‐lean. For illustration purposes, the recordings on the left were low‐pass filtered at 10 Hz
