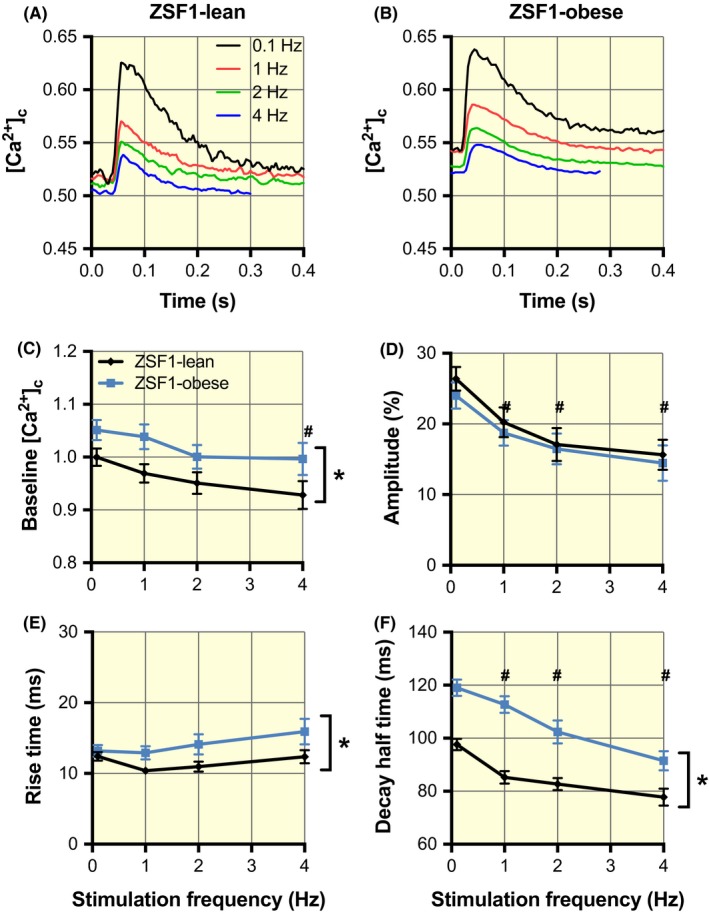
Figure 5.

Increased cytosolic Ca2+ concentrations at baseline and slowing of cytosolic Ca2+ release and uptake in the ZSF1‐obese group. A and B, Averaged cytosolic Ca2+ transients (F340/F380 ratio) obtained at stimulation frequencies of 0.1, 1, 2 and 4 Hz in ZSF1‐lean and ZSF1‐obese respectively. C, The cytosolic Ca2+ concentration at baseline was significantly larger in ZSF1‐obese than in ZSF1‐lean. At 4 Hz, the baseline values were significantly smaller than at 0.1 Hz. D, The amplitude of the Ca2+ transients was frequency‐dependent but not significantly different in ZSF1‐obese compared to ZSF1‐lean. E, The rise time in ZSF1‐obese was larger than in ZSF1‐lean. F, The decay half‐time was significantly larger in ZSF1‐obese than in ZSF1‐lean and in both groups decreased with an increase in stimulation frequency. The average values (±SEM) at 0.1, 1, 2 and 4 Hz were obtained from 27, 28, 22 and 16 different cells in ZSF1‐lean and from 70, 64, 53 and 33 different cells in ZSF1‐obese respectively. *P < .05 vs ZSF1‐lean; #P < .05 vs 0.1 Hz (two‐way ANOVA). No significant interaction was observed between groups and stimulation frequency
