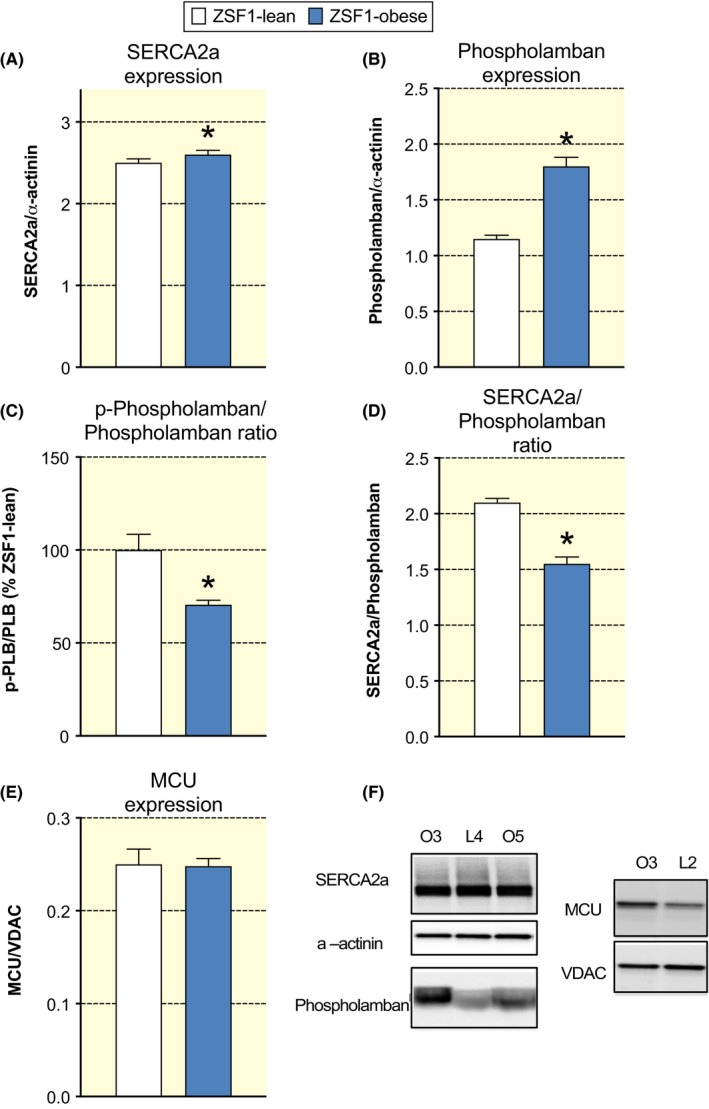
Figure 6.

Preserved SERCA2a and MCU expression and increased phospholamban expression in ZSF1‐obese. A, Averaged SERCA2a/α‐actinin ratio in ZSF1‐lean and ZSF1‐obese did not differ significantly. B, Averaged phospholamban/α‐actinin ratio in the ZSF1‐obese group was significantly larger than in the ZSF1‐lean group. C, Averaged phosphorylated phospholamban/phospholamban ratio in the ZSF1 group was significantly increased (~36%) than in ZSF1‐lean. *P < .05, n = 6 animals in both groups. D, Averaged SERCA2a/phospholamban ratio in the ZSF1‐obese group was significantly smaller (~25%) than in the ZSF1‐lean group. *P < .05, n = 6 animals in both groups. E, Averaged MCU/VDAC ratio in ZSF1‐lean and ZSF1‐obese did not differ significantly. F, Examples of Western immunoblots of cardiac tissue using SERCA2a, phospholamban antibodies from two ZSF1‐obese animals (O3 and O5) and one ZSF1‐lean animal (L4). Examples of Western immunoblots of cardiac tissue using MCU antibody from two ZSF1‐obese animals (O3 and O5) and one ZSF1‐lean animal (L4). The α‐actinin and mitochondrial voltage‐dependent anion channel (VDAC) protein expression were used to correct for protein content
