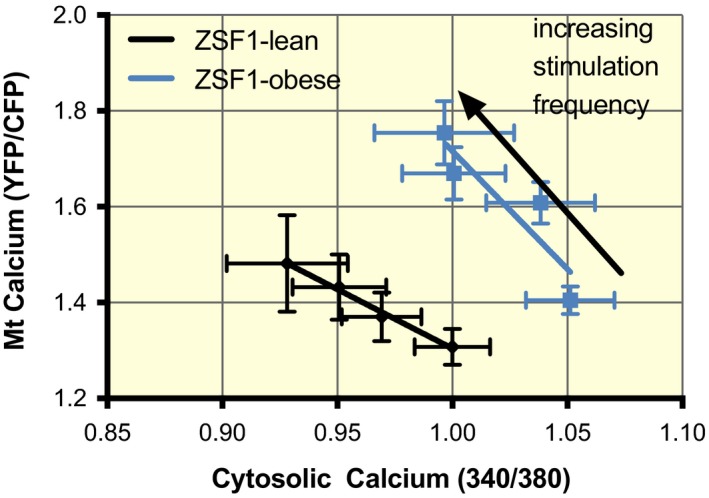
Figure 7.

The relationship between end‐diastolic mitochondrial and cytosolic calcium. During the cellular measurement (from Figures 1, 2 and 4), end‐diastolic mitochondrial [Ca2+] was higher for a given end‐diastolic cytosolic [Ca2+] at various stimulation frequencies. End‐diastolic mitochondrial [Ca2+] increased with increasing stimulation frequency while end‐diastolic cytosolic Ca2+ concentration decreased. The R2 of the ZSF1‐lean animals was 0.99. A highly significant rightward shift in the ZSF1‐obese animals was observed (P = 0.002), but the slope was not different (P = 0.19)
