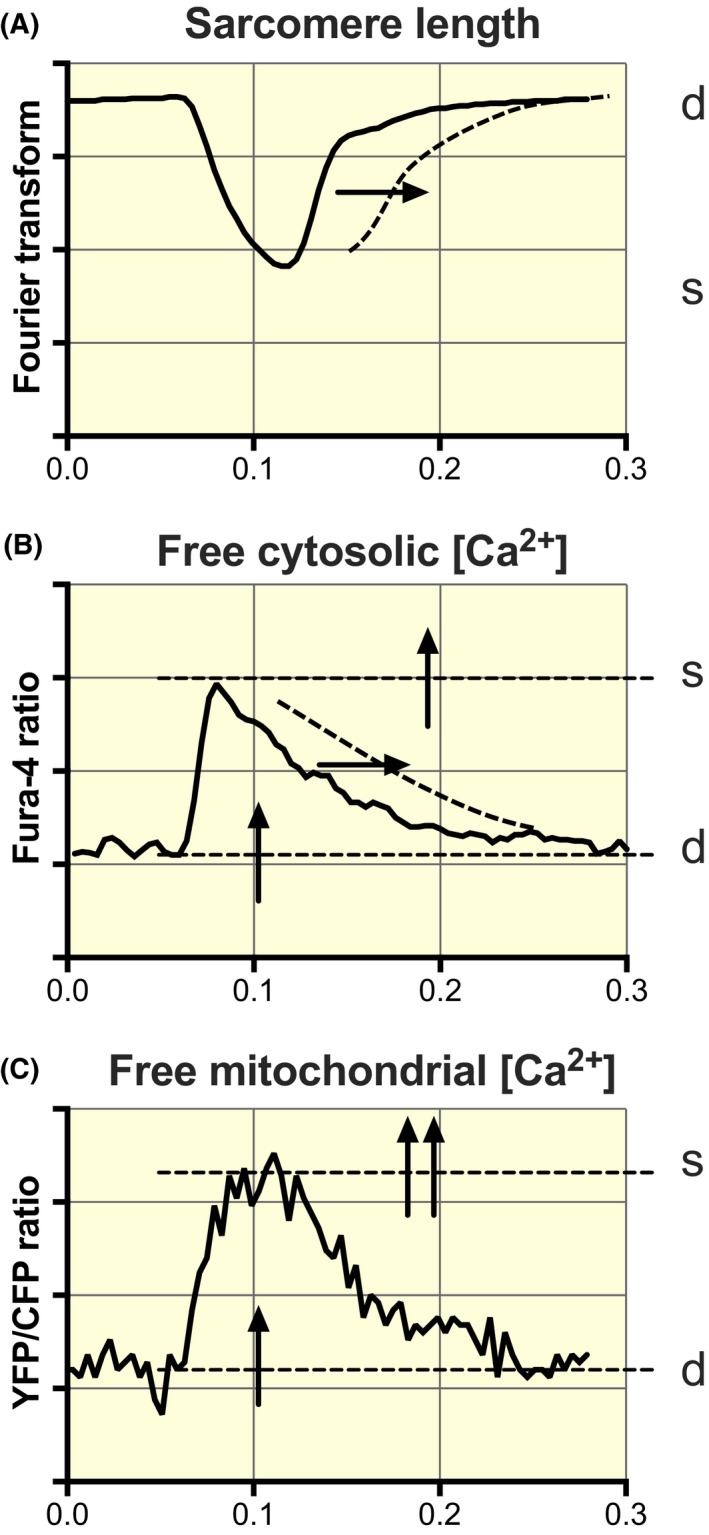
Figure 10.

Schematic diagram of alterations in cytosolic and mitochondrial calcium handling in HFpEF at a near‐physiological stimulation frequency (4 Hz). The dotted lines and the arrows denote alterations in ZSF1‐obese relative to ZSF1‐lean. A, Slowing of the sarcomeric relaxation phase. B, Increase in cytosolic [Ca2+] during rest (d) and at peak contraction (s) and slowing of the decay in the cytosolic Ca2+ transient, while the amplitude of the Fura‐4 transient remains the same. C, Increase in mitochondrial [Ca2+] during rest and contraction, while the kinetics of mitochondrial Ca2+ uptake and extrusion are preserved. Both the baseline and the amplitude of the mitochondrial YFP/CFP ratio are increased; this results in a more significant increase in the peak systolic level than at the diastolic level
