Figure 3.

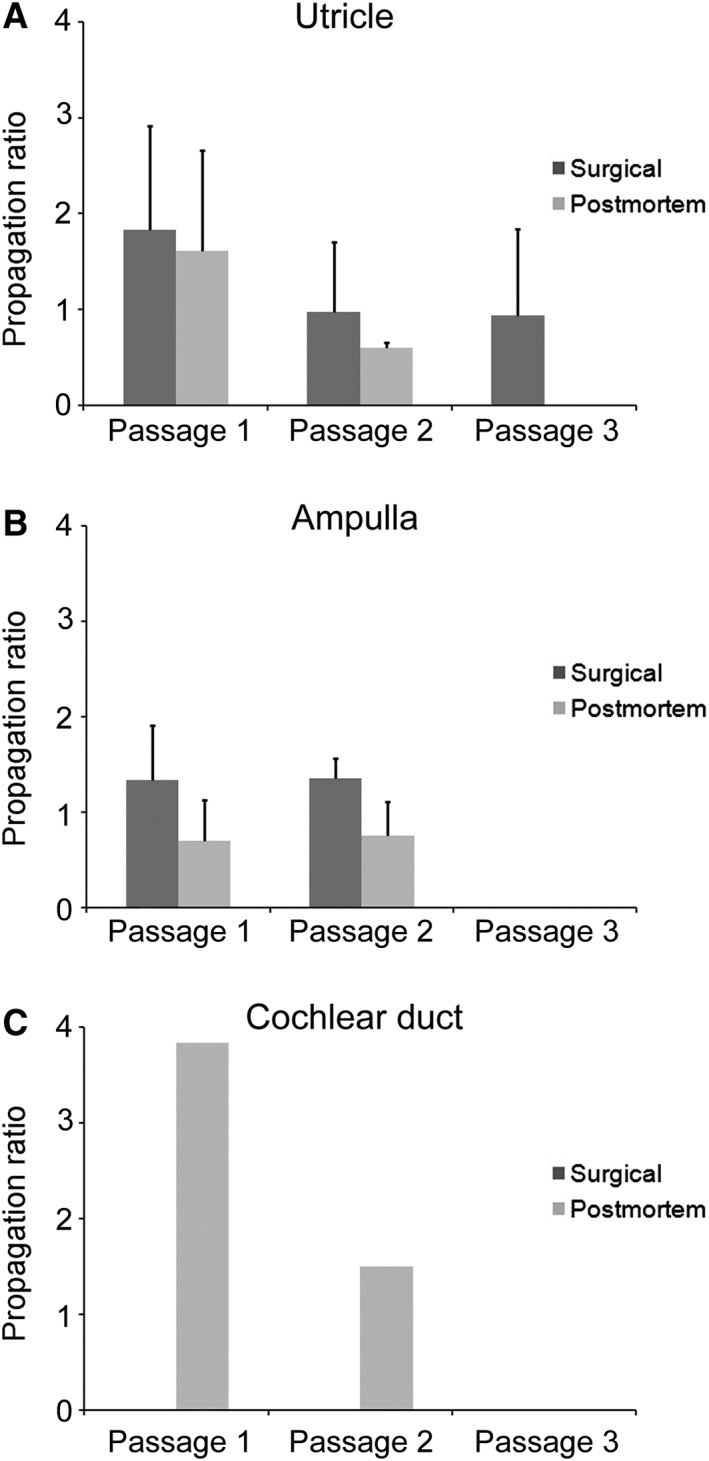
Mean propagation ratios (number of daughter spheres per one mother sphere) for utricle (A), ampulla (B), and cochlear duct (C) are shown with one positive standard deviation for surgical and postmortem specimens.

Mean propagation ratios (number of daughter spheres per one mother sphere) for utricle (A), ampulla (B), and cochlear duct (C) are shown with one positive standard deviation for surgical and postmortem specimens.