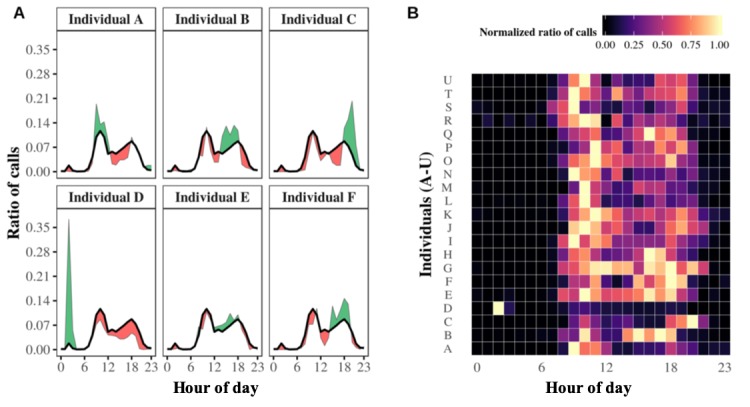
Figure 3.

Circadian patterns of outgoing telephone call activities at the individual level. Panel A. Individual circadian patterns of the outgoing telephone call activity profiles of 6 distinct egos. Each small graph shows a specific ego. The black line represents the average circadian pattern of outgoing telephone calls for the population, whereas the individual’s circadian pattern of calling is represented by a green or red area indicating higher or lower outgoing telephone calls than the average. Panel B. Heat map showing 21 individual outgoing telephone call patterns. The entire population’s normalized individual circadian patterns are shown aggregated onto one heat map. Each horizontal strip summarizes the circadian pattern of one ego, associating each hour of the day with the corresponding ratio of outgoing telephone calls in appropriately colored boxes. The greater the ratio of outgoing telephone calls, the brighter the corresponding box.
