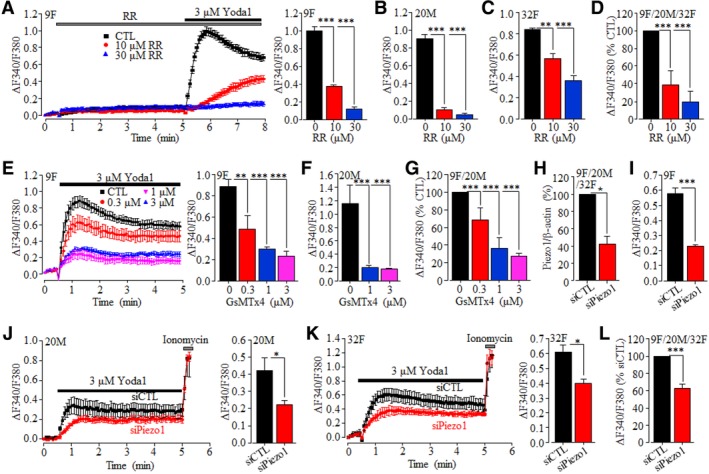
Figure 2.

Pharmacological and genetic inhibition of Yoda1‐induced Piezo1‐mediated intracellular Ca2+ responses in hDP‐MSC. A‐C, Yoda1‐induced Ca2+ responses (9F) and peak Ca2+ responses (9F, 20M, and 32F) in control cells and cells treated with ruthenium red (RR) for 5 minutes from one set of experiments using 3‐4 wells of cells for each condition. D, Summary of Yoda1‐induced peak Ca2+ responses in RR‐treated cells from 9F, 20M, and 32F, as percentage of that in control cells, from three independent experiments. E,F, Yoda1‐induced Ca2+ responses (9F) and peak Ca2+ responses (9F and 20M) in control and cell prior treated with GsMTx4 for 30 minutes from one set of experiments using 3‐4 wells of cells for each condition. G, Summary of Yoda1‐induced peak Ca2+ responses in GsMTx4‐treated cells as percentage of that in control cells from four independent experiments using cells from 9F and 20M. H, Summary of Piezo1/β‐actin in cells transfected with siCTL or siPiezo1 as percentage of that in siCTL‐transfected cells from eight independent experiments using cells from 9F, 20M, and 32F. I‐K, Yoda1‐induced Ca2+ responses in cells transfected with siCTL or siPiezo1 from 9F (I), 20M (J), and 32F (K) from one set of experiments using four wells of cells for each condition. Cells were exposed to 5 μM ionomycin at the end of recordings (J, K). L, Summary of peak Yoda1‐induced Ca2+ responses in siPiezo1‐transfected cells as percentage of that in siCTL‐transfected cells from five independent experiments using from 9F, 20M, and 32F, *P < .05; **P < .01; and ***P < .001
