
Figure 3.
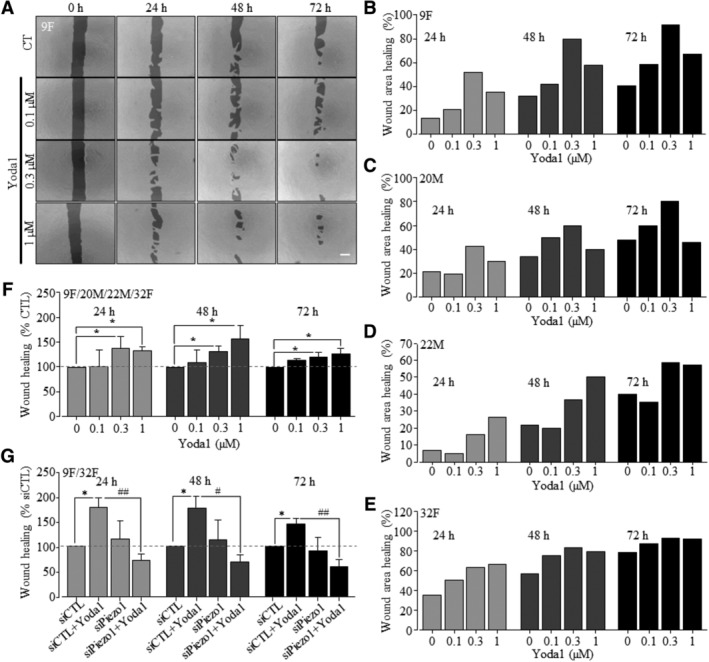
Yoda1‐induced activation of the Piezo1 channel stimulates hDP‐MSC migration. A, Representative images showing the wound areas at 0, 24, 48, and 72 hours, using cells from 9F in the absence (CTL) and presence of indicated concentrations of Yoda1 in the culture medium. Scale bar = 500 μm. B‐E, Wound healing indicated by the reduction in the wound areas as percentage of the wound area at 0 hour using cells from 9F (B, as shown in A), 20M (C), 22M (D), and 32F (E). F, Summary of the mean wound healing as percentage of that under control conditions at the same time points in parallel experiments from eight independent experiments using all four donors shown in A‐E. G, Summary of mean wound healing under indicated conditions, from five independent experiments using cells from 9F and 32F that were transfected with control siRNA (siCTL) and Piezo1‐specific siRNA (siPiezo1). *P < .05 compared to control condition at the same time points. # P < .05 and ## P < .001 compared to cells transfected with siCTL and exposed to Yoda1