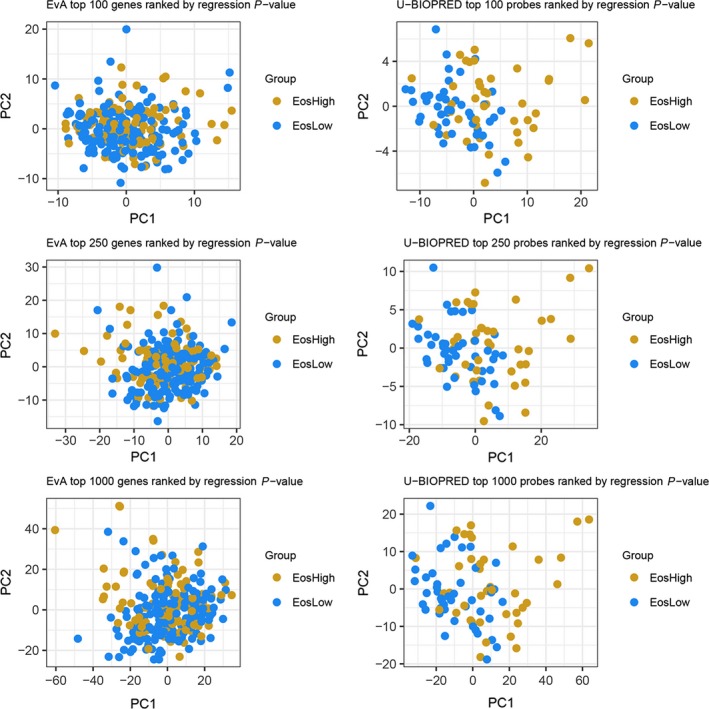
Figure 1.

Principal component analysis plots derived from the top 100, 250 and 1000 genes determined by the regression analysis from the COPD (EvA) and asthma (U‐BIOPRED) subjects. Blue dots and red dots represent individual subjects dichotomized by the blood eosinophil count (>200 eosinophils/μL)
