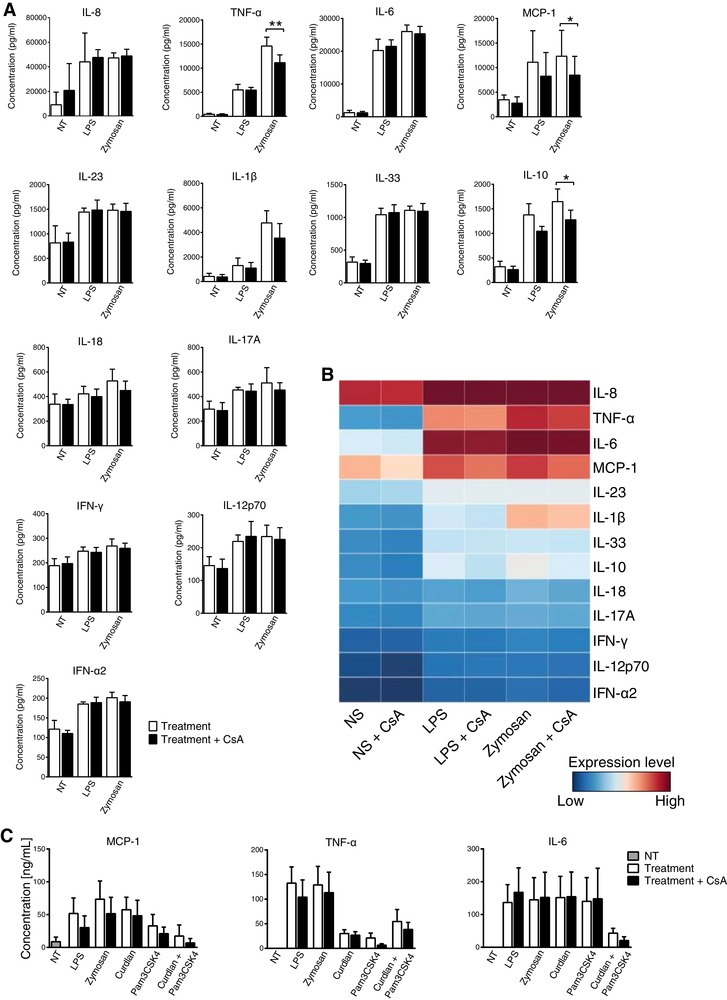
Figure 4.

Influence of CsA treatment on the production of inflammatory cykokines/chemokines by human monocytes in response to PRR ligands. A) Cytokine bead array data show significantly lower secretion of TNF‐α, IL‐10, and MCP‐1 by CsA treated monocytes upon zymosan stimulation. Data are representative of 5 donors. Statistical analysis was performed by RM one‐way ANOVA followed by Tukey's multiple comparisons test (* P < 0.05, ** P < 0.01). Data represent the means ± sd. B) Inflammatory cytokine and chemokine expression levels determined using a 13‐plex cytokine bead array. Each row represents a specific cytokine or chemokine as indicated at the right side of the heat map. Each column represents measurements of these molecules in nontreated control (NT) or stimulated (LPS, zymosan) monocytes in the presence or absence of CsA. C) Protein expression of MCP‐1, TNF‐α, and IL‐6 in response to 18 h stimulation with PamCSK4, LPS, or curdlan in the presence or absence of CsA analyzed by ELISA
