Figure 5.

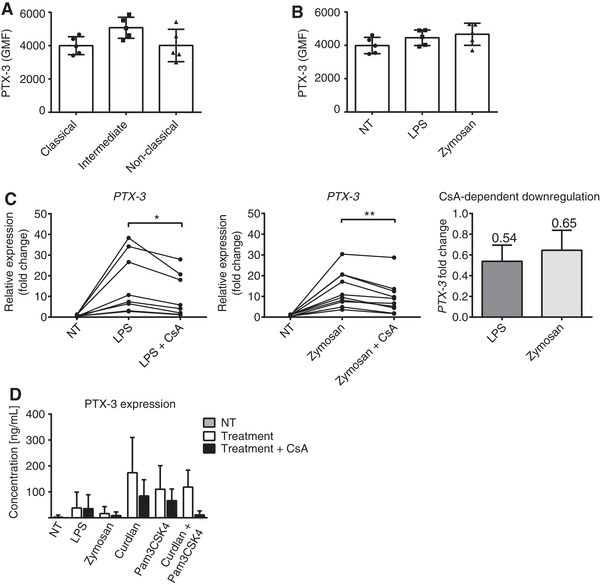
Expression of PTX‐3 in human monocytes. A‐B) Flow cytometric measurement of intracellular PTX‐3 protein level in human monocyte subsets at steady‐state (A) and following 4 h of stimulation with either zymosan or LPS (B). (C) PTX‐3 mRNA expression measured by qPCR. CsA‐dependent PTX‐3 down‐regulation was calculated in LPS and zymosan treated samples as the ratio between CsA treated and nontreated samples. (D) Secretion of PTX‐3 by monocytes stimulated with a variety of PRR ligands, as measured by ELISA. Monocytes were pre‐treated or not with CsA and then stimulated with PRR ligands for 4 h. Data are representative of 7–9 donors. Statistical analysis was performed by RM one‐way ANOVA followed by Tukey's multiple comparisons test (* P < 0.05, ** P < 0.01). Data represent the means ± sd
