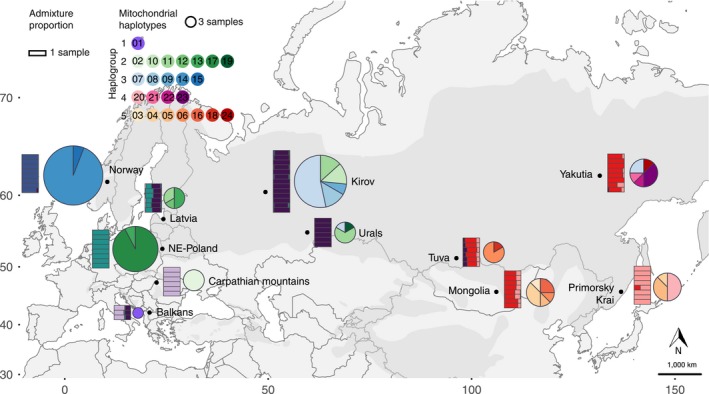
Figure 1.

Distribution of mitogenomic and nuclear autosomal variation across Eurasian lynx populations. Pie charts represent the frequency of each of the 24 identified mitochondrial genome haplotypes in each population (right), and rectangles depict the ancestry of individuals in each of six genetic clusters, as estimated with NGSAdmix (left)
