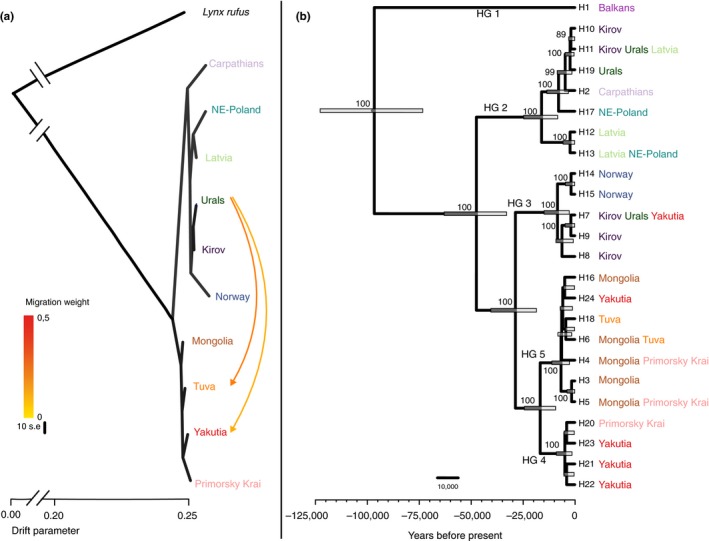
Figure 3.

(a) Population tree inferred with treemix from nuclear autosomal data. Each arrow represents a migration event with its weight specified through the colour scale. (b) Bayesian maximum clade credibility tree inferred with beast depicting the relationship among mitogenome haplotypes. Numbers on nodes represent their posterior probability; only those over 0.85 are depicted
