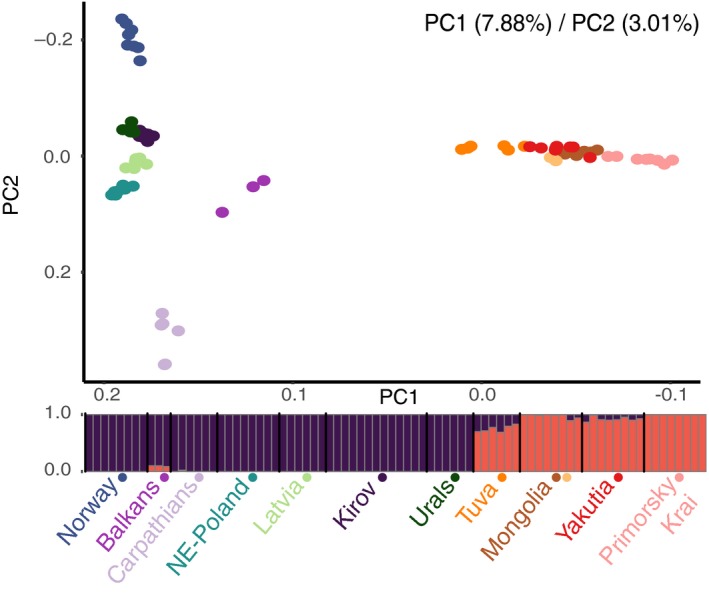
Figure 4.

Relationship among individuals based on nuclear autosomal genotypes. PCA separates eastern and western individuals in the first axis (7.88% of the variance explained), and westernmost populations in the second axis (3.01% of the variance explained). Individual ancestry in each of the two clusters defined in the NGSAdmix analysis. Populations are sorted from west to east. Two different colours represent the Mongolia population, as this population comprises two different habitats (orange representing Ömnögovi, and brown Central and Khentii Aymag)
