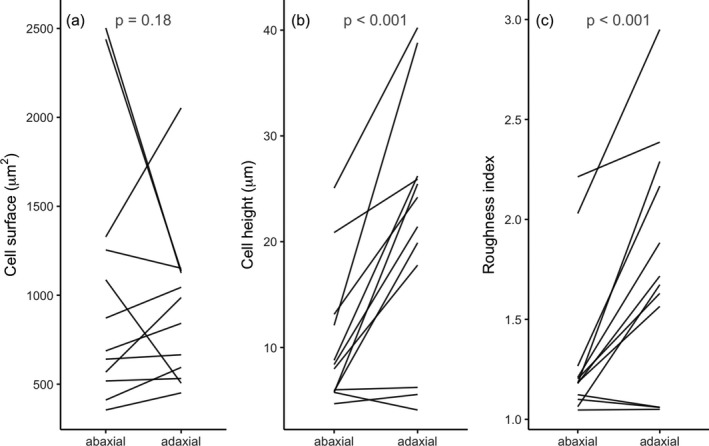
Figure 3.

Floral epidermal cell shape for different flower sides. (a) Cell surface, (b) cell height, (c) roughness index. Each line connects the mean values of different sides of the flower. [Correction added on 10 January 2020 after first publication: the figure caption has been updated in this version.]
