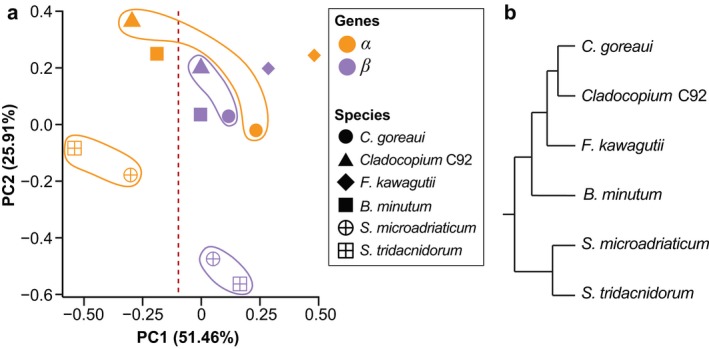
Figure 1.

Variation among α and β genes from six Symbiodiniaceae genomes. (a) PCA plot based on ten metrics of the predicted genes, shown for the α genes in orange, and the β genes in purple, for each of the six genomes (noted in different symbols) as indicated in the legend. The two Cladocopium and the two Symbiodinium species were highlighted for clarity. (b) Tree topology depicting the phylogenetic relationship among the six taxa, based on LaJeunesse et al. (2018). [Color figure can be viewed at http://wileyonlinelibrary.com]
