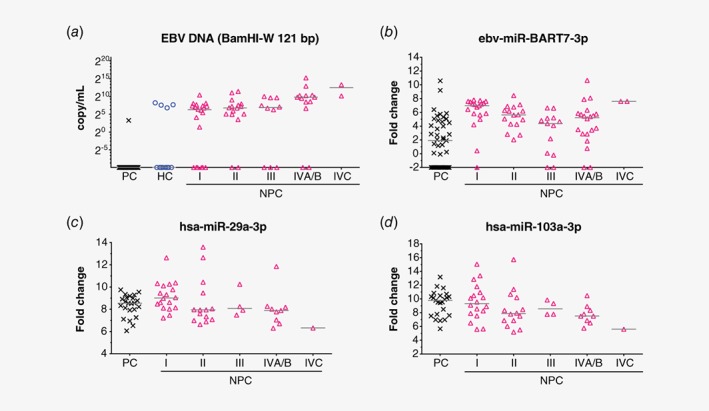
Figure 2.

Evaluation of newly reported plasma biomarkers to detect NPC against controls in our study subset. (a) Plasma EBV DNA trend as measured by BamHI‐W 121 bp is similar to the other two EBV DNA tests in Figure 1. (b) NPC patients generally had higher plasma levels of ebv‐miR‐BART7‐3p. A portion of healthy donors also had detectable level of plasma ebv‐miR‐BART7‐3p. (c, d) Decreasing plasma levels of hsa‐miR‐29a‐3p and hsa‐miR‐103a‐3p were observed from early stage NPC to advanced stage NPC. Plasma levels of these two human miRNAs were not significantly different between population controls and Stage I NPC (p > 0.05). Samples with undetectable plasma BamHI‐W 121 bp were arbitrarily set as 0.001 copy/ml and samples with undetectable plasma ebv‐miR‐BART7‐3p were arbitrarily set as −2 fold change over detection limit. Abbreviations: HC, hospital control; PC, population control. [Color figure can be viewed at http://wileyonlinelibrary.com]
